News
AI Datacentre Water Demand Surge: Satellite Verification
New industry forecasts show global data centre water consumption could triple by 2030 as AI expansion accelerates. Satellite imagery allows traders to verify cooling infrastructure expansion and local hydrological stress before utility reports update.
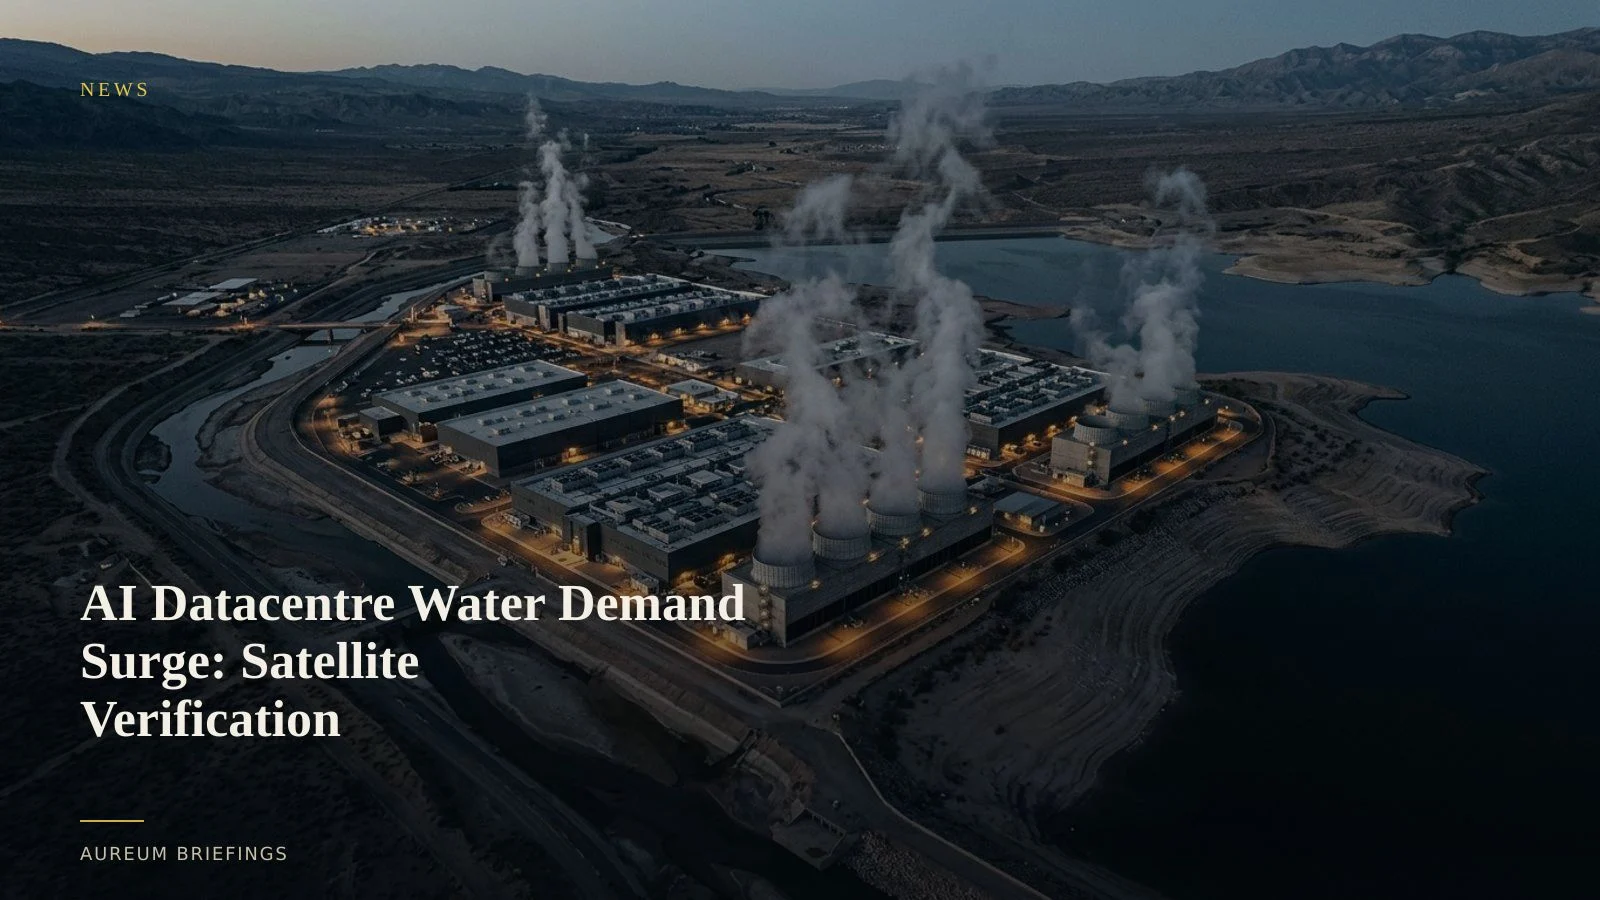
Surging AI compute scales local water consumption
Hyper-scalers building out artificial intelligence campuses are encountering a critical operational bottleneck: freshwater supply. According to data centre water consumption projections published by Rystad Energy, global data centre water usage could rise to 644 billion litres annually by 2030 without active mitigation.
Evaporative cooling towers and liquid-to-chip heat exchangers remain the standard methods for cooling high-density GPU clusters. These systems require continuous water volume, placing intense physical demands on municipal water networks and local aquifers.
While power grid capacity dominates public headlines, localized water stress represents an immediate risk to project commissioning schedules. When municipal authorities cap utility drawdowns, datacentre operators must adjust cooling designs or slow chip deployments.
Tracking cooling structures and reservoir stress from space
Financial markets usually rely on voluntary corporate reporting or delayed state environmental permits to evaluate cooling water drawdowns. Satellite-backed analysis changes this by evaluating physical footprint alterations directly at the facility site.
Medium-resolution optical satellites, such as those in the European Space Agency Copernicus fleet, monitor changes in surface water levels, retention ponds, and local vegetation health surrounding major industrial campuses.
By cross-referencing surface thermal signatures with physical facility ground clearing, analysts can observe active cooling operations and track campus expansion milestones without waiting for municipal utility releases.
Identifying regional water stress before regulatory halts
Datacentre clusters are frequently concentrated in regions already experiencing seasonal water deficits. Cross-referencing drought monitor tracking data alongside satellite imagery provides early visibility into local resource competition.
When local agricultural and municipal demands compete with cooling requirements, physical imagery reveals where site development stalls. Substation activity, ground clearing, and water piping trenching show whether a planned expansion remains on track.
Large institutional commodity desks pay six-figure sums for custom satellite feeds to monitor utility infrastructure. Independent traders and analysts can now verify these physical changes without a dedicated remote sensing team.
Integrating Earth observation into physical commodity analysis
Evaluating physical infrastructure shifts requires consistent measurement across multiple satellite passes. DIY investors using free tools often struggle with out-of-date imagery or uncalibrated raw frames.
Aureum bridges this gap by turning satellite data into actionable answers. With Query, traders enter plain-language prompts regarding facility expansion or regional water body variations and receive evidence-backed synthesis.
For broader monitoring, Track provides hand-built KPI boards across critical industrial corridors, helping investors follow physical supply chain stress as it develops.
Run the physical verification workflow
Private beta is open. Ask Earth a question about hyperscale buildouts, or follow hand-built Track boards on industrial infrastructure.