News
Surging Tanker Rates: Verifying Vessel Staging With Satellites
Global crude freight rates have spiked as tankers adopt complex re-routing workarounds. Satellite imagery reveals whether vessels are queuing at anchorages or moving crude.
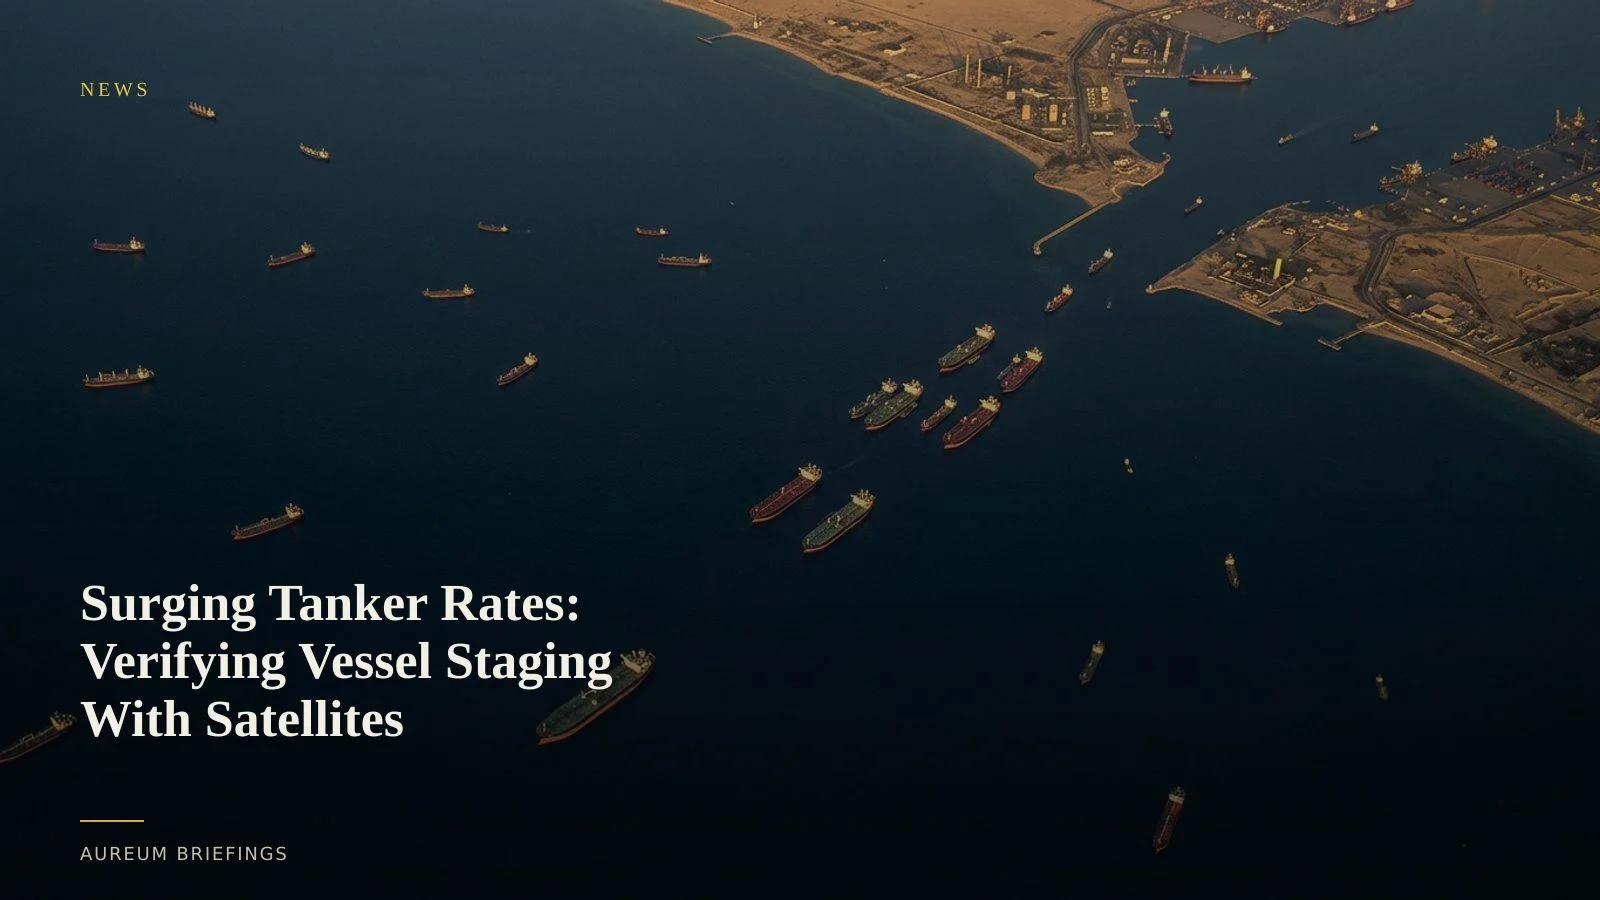
Global crude freight rates hit record levels as routes elongate
Global crude shipping markets are under heavy strain as global tanker freight rates surge to record levels. Drawn-out geopolitical friction in Middle Eastern maritime corridors is forcing shipowners, refiners, and state trading desks to execute complex maritime workarounds, increasing ton-mile demand across long-haul trade lanes.
When Very Large Crude Carriers (VLCCs) and Suezmax tankers divert around the Cape of Good Hope or hold outside restricted operational zones, shipping capacity shrinks rapidly. Official freight prints from the Baltic Exchange crude tanker benchmarks reflect the immediate financial impact, but paper indices lag the physical movements taking place across regional anchorages.
Using satellite radar to verify vessel staging and port queues
Paper rate spikes signal market fear, but satellite intelligence verifies whether physical crude is actually moving or accumulating on the water. Synthetic Aperture Radar (SAR) sensors penetrate cloud cover and darkness to detect vessel signatures regardless of whether Automatic Identification System (AIS) transponders are active.
By measuring vessel density across key staging anchorages, such as Fujairah, Singapore, and West African ship-to-ship zones, traders can observe whether high charter rates stem from physical congestion or precautionary holding. Synthetic radar allows analysts to count anchored hulls, evaluate draft depth proxies, and identify structural long-haul diversions weeks before official volume prints from the EIA petroleum supply data confirm supply disruptions.
Bridging macro analysis and physical vessel tracking
Geopolitical think tanks and policy institutes, such as the Atlantic Council energy analysis, routinely highlight how regulatory changes and security risks re-route global trade flows. However, translating high-level policy analysis into actionable trading decisions requires physical verification on the ground and at sea.
When shipping lines alter transit behaviour to avoid risk zones, the immediate result is prolonged anchorage times and altered refilling schedules at downstream terminals. Optical satellite passes confirm whether tank farm storage levels at receiving hubs are depleting while tankers wait in offshore queues.
Integrating satellite intelligence into physical market analysis
Traders without institutional geospatial teams often rely on dated map tiles or lagging news alerts. Aureum changes this workflow by delivering structured, satellite-backed evidence directly tied to market decisions.
Through Query, traders can ask plain-English questions about specific anchorage zones or storage terminals. Through Track, market participants follow curated, hand-built KPI boards covering critical global energy corridors to observe physical changes as new satellite coverage lands.
Verify physical commodity flows from space
Join the private beta. Ask Earth a question with Query, or follow curated hand-built Track boards on strategic maritime assets.