Briefing
Tracking Distillate Crack Spreads With Satellites
When diesel and heating oil inventories tighten, refining margins widen fast. Here is how satellite observations verify product output and tank levels before official prints.
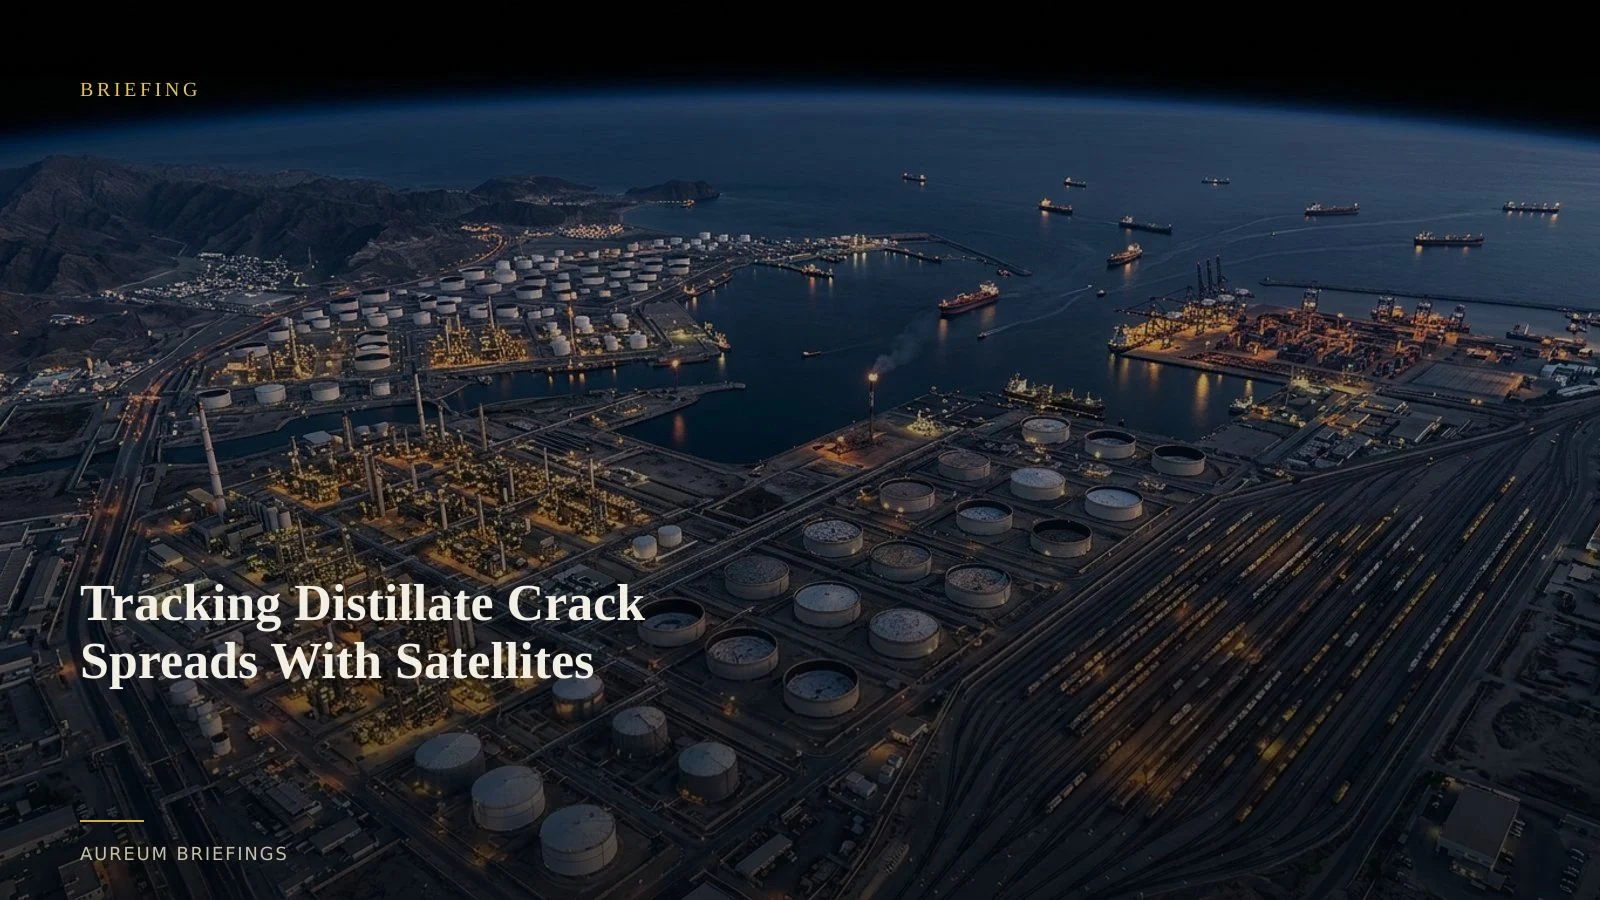
Distillate tightness drives refining margins
According to the EIA diesel price component summary, distillate fuel oil prices are shaped by crude input costs, distribution overhead, taxes, and refining crack spreads. When global distillate inventories tighten while crude costs fluctuate, refining margins expand rapidly, driving up diesel and heating oil benchmarks across key distribution hubs.
Large institutional operations monitor these supply constraints through dedicated research setups and specialist data pipelines. For independent traders and DIY investors, obtaining physical evidence of refining runs and fuel accumulation has traditionally meant relying on delayed official publications or prohibitively expensive enterprise feeds.
Thermal and optical verification of refinery throughput
To anticipate shifts in product supply, analysts measure physical activity at major crude processing facilities and coastal export terminals. Satellite sensors track operational thermal signatures from flare stacks and process units, confirming whether refineries are running at elevated capacity or undergoing unannounced maintenance.
With the deployment of Earth observation assets like the ESA Copernicus Sentinel-3 mission, environmental and land monitoring imagery delivers consistent observations across ocean routes and industrial corridors. When combined with optical imagery from European Space Agency Copernicus satellites, traders can observe vessel berth occupancy at fuel discharge ports and monitor storage farm conditions across major refining clusters.
Why physical product tracking beats lagging inventory prints
Official inventory releases provide essential historical baselines, but they summarise past operations. By the time a government report confirms a drawdown in distillate stocks, derivative markets have frequently priced in the shift.
Measuring physical changes at tank farms using satellite shadow analysis offers a direct line into storage utilisation. Floating-roof tanks cast internal shadows proportional to the liquid volume remaining, allowing analysts to quantify inventory changes before official statistics clear the wires.
Evaluating refining runs without institutional GIS teams
Institutional commodity trading operations typically rely on enterprise geospatial services to monitor physical supply chains. Individual investors without internal remote-sensing capabilities usually turn to free mapping applications, which frequently display imagery that is months out of date.
Aureum bridges this gap by combining plain-English querying with curated monitoring. Through Query, traders ask specific questions regarding facility activity or product storage. Through Track, users follow hand-built KPI boards covering critical refining corridors and maritime supply hubs.
Track physical commodity markets with satellite evidence
Free to join during the beta. Ask Earth a question with Query, or follow hand-built Track boards covering key industrial and trade corridors.