News
East-West Pipeline Hit as Hormuz Talks Collapse: Satellite Verification
Brent crude broke past $108 per barrel after a drone strike disabled Saudi Arabia's primary bypass pipeline and Gulf states called off negotiations over the Strait of Hormuz. Satellite intelligence provides independent verification of loading activity at Yanbu and vessel staging across critical energy chokepoints.
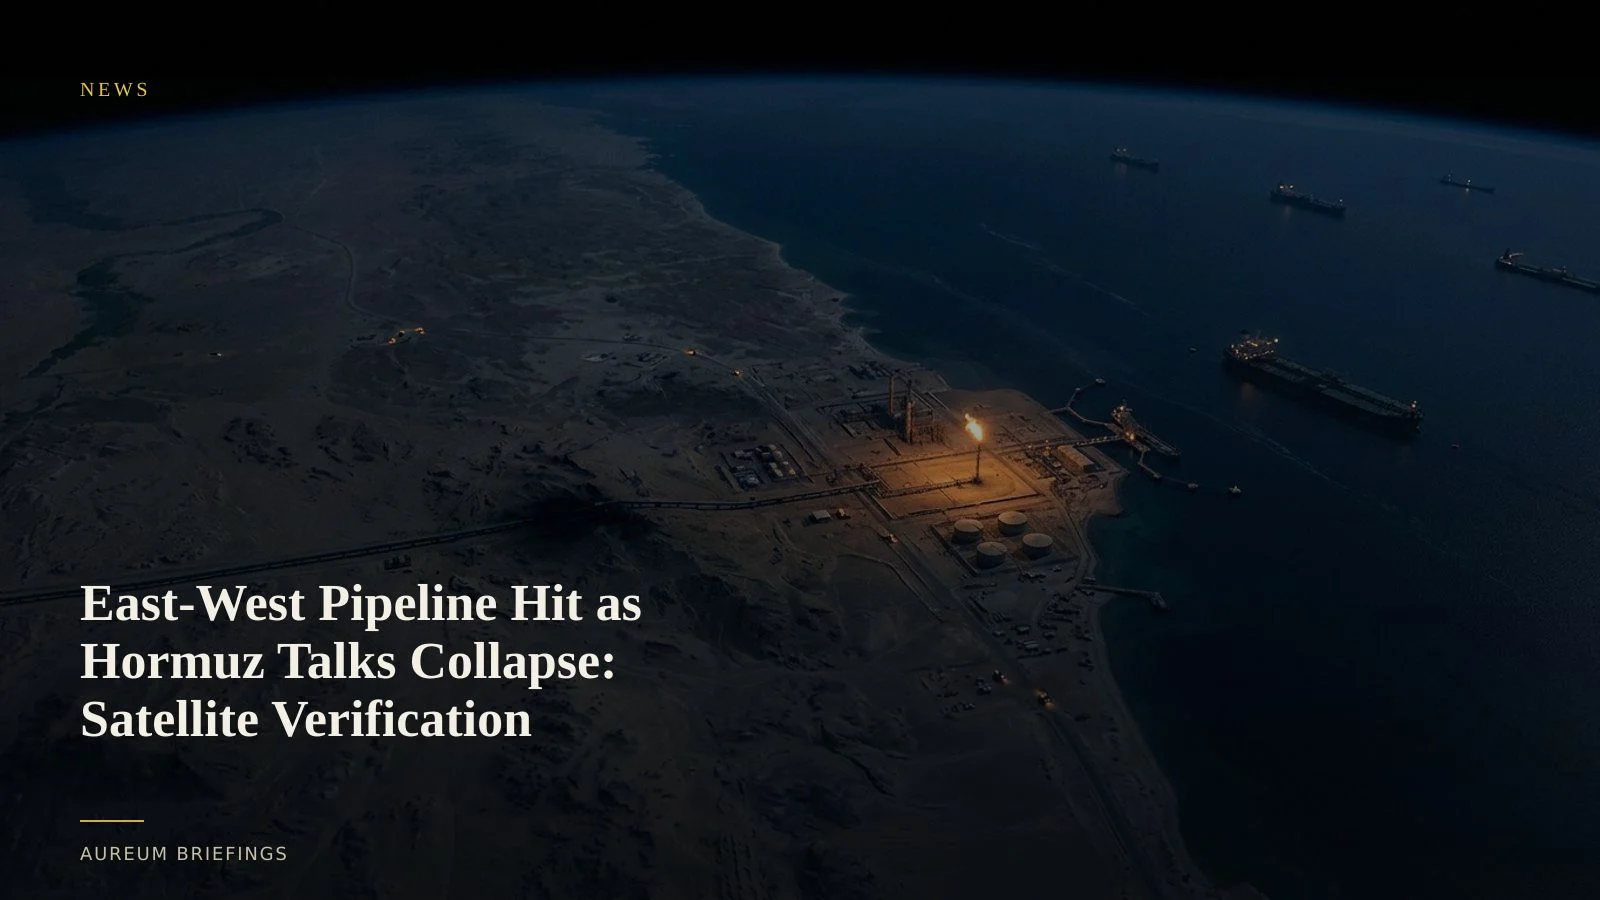
Saudi crude bypass severed as diplomatic talks freeze
Global energy markets experienced a dual physical shock on Monday as Brent crude surged past $108 per barrel. Gulf states suspended scheduled negotiations with Iran regarding the reopening of the Strait of Hormuz, coinciding with Houthi missile and drone strikes targeting Saudi Arabia's King Khalid airbase in Khamis Mushait.
The diplomatic standstill follows a strike by regional militias that disabled Saudi Arabia's 7-million-barrel-per-day East-West pipeline (Petroline), according to energy market reporting on crude price spikes. Because Petroline represents the kingdom's sole overland artery bypassing the Strait of Hormuz to reach the Red Sea port of Yanbu, its disruption leaves maritime transit severely constrained.
This supply friction arrives while broader global trade relationships face structural strain, as noted in recent macro economic policy research on international trade agreements, leaving energy markets exceptionally sensitive to physical infrastructure outages.
Measuring Yanbu terminal dwell times and Red Sea export bottlenecks
When pipeline throughput stops or drops unexpectedly, physical supply chains react immediately. Very Large Crude Carriers (VLCCs) staged off Yanbu must either wait for tank storage discharge or pivot away from the terminal entirely.
Official prints such as the EIA weekly petroleum inventory reports provide retrospective benchmarks, but they lag sudden physical disruptions by days or weeks. Traders watching maritime benchmarks from Clarksons shipping market commentary need visual and spatial evidence to confirm whether tankers at Yanbu are actively receiving crude or idling in anchorage.
Satellites measure physical storage roof levels and berth occupancy directly. By comparing synthetic aperture radar passes and optical scenes, analysts evaluate whether Yanbu's tank farm is depleting reserves to maintain export flow or if berth loading rates have stalled.
Why official headline narratives lag physical ground reality
During severe geopolitical events, headline news moves fast while verified ground truth updates slowly. Institutional commodity desks frequently purchase dedicated satellite analytics from enterprise platforms like Ursa Space oil storage monitoring or high-frequency radar datasets from ICEYE commercial SAR satellite operations.
DIY investors lacking institutional research budgets often depend on free mapping tools, which frequently serve imagery months out of date without analytical contextualisation.
Satellite intelligence bridges this gap by observing infrastructure directly. Radar imagery penetrates cloud cover and smoke to confirm whether pumping infrastructure, terminal berths, and vessel lanes show physical activity consistent with official claims.
Verifying physical volumes across Middle East export hubs
Evaluating energy market shocks requires structured physical observation across multiple nodes. First, optical imagery from ESA Copernicus Sentinel satellite missions assesses floating-roof shadow positions at terminal storage farms like Yanbu and Fujairah to calculate volume changes.
Second, Synthetic Aperture Radar (SAR) tracks vessel staging in anchorages regardless of weather conditions or AIS transceiver status. When tankers go dark or change destinations during geopolitical stress, SAR passes confirm their physical presence and draft changes.
Combining terminal storage measurements with vessel transit counts provides an independent assessment of crude movement before weekly inventory publications reflect the change.
How independent traders act on satellite evidence
When headline volatility hits commodity markets, traders face a choice between guessing headline sentiment or verifying physical reality.
With Aureum Query, you can ask plain-English questions about facility activity, such as checking berth occupancy or storage levels at specific crude terminals. With Aureum Track, you follow hand-built KPI boards on key maritime corridors to see how global flows adjust when major pipelines go offline.
By focusing on physical evidence rather than market rumours, individual traders can evaluate supply shocks with clarity.
Bridge the satellite intelligence gap
Private beta is open. Query satellite evidence for specific facilities or follow hand-built Track boards on global commodity bottlenecks.