Briefing
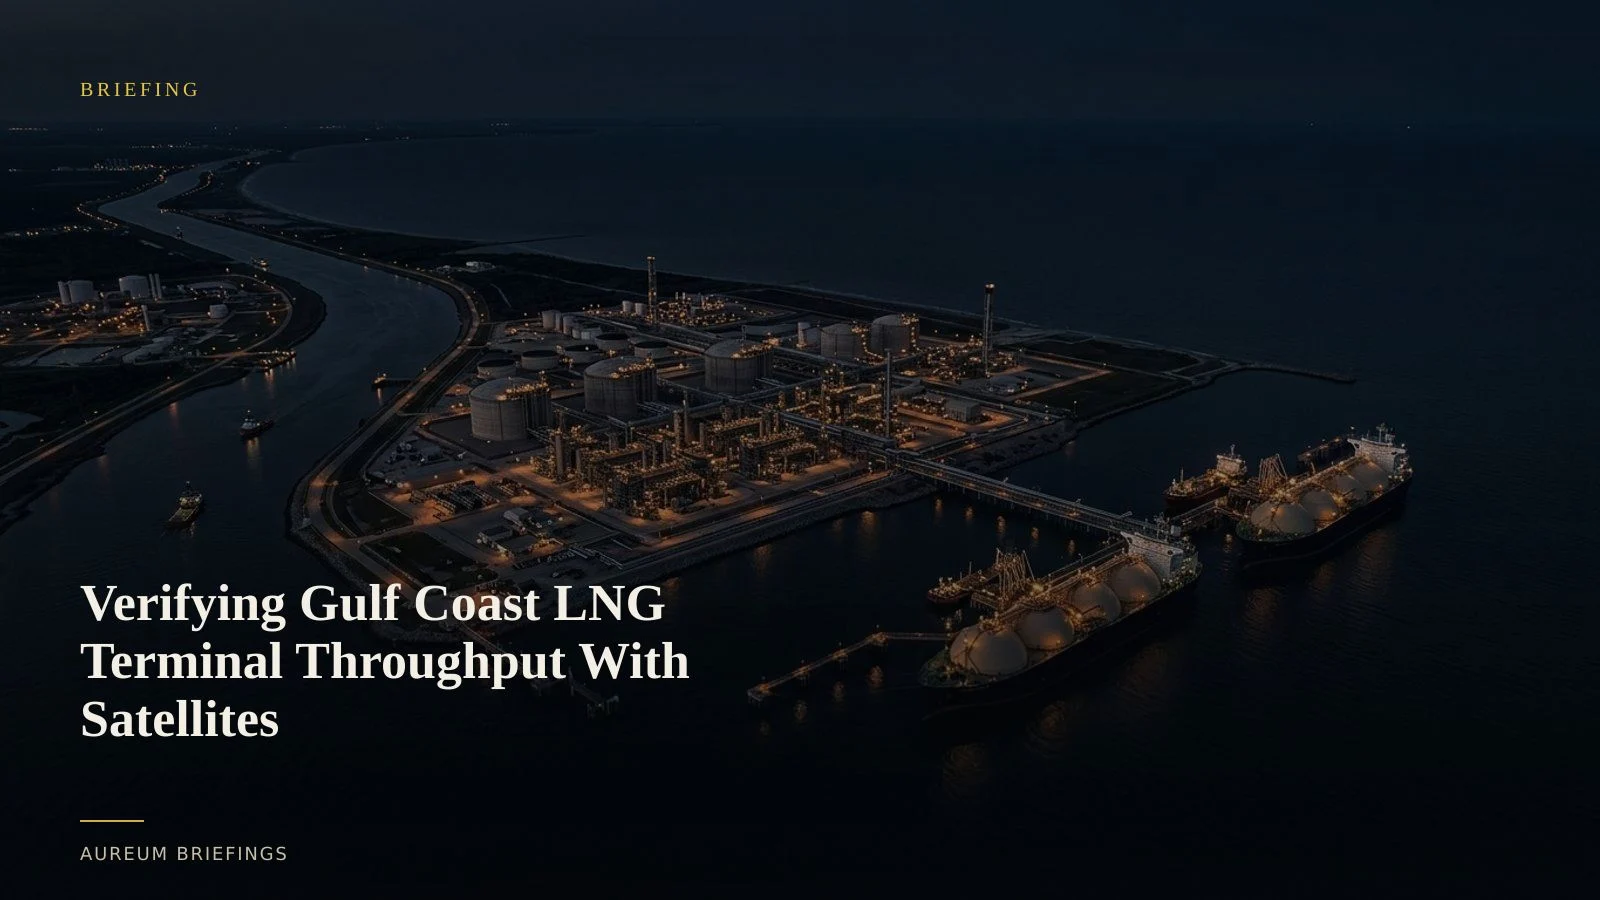
Verifying Gulf Coast LNG Terminal Throughput With Satellites
When major natural gas export expansions clear operational hurdles, official government data lags physical liquefaction. Satellite evidence reveals actual terminal throughput before market prints catch up.
Capacity announcements do not guarantee physical exports
Corporate operational updates frequently signal milestone completions for massive energy export projects. Recent EIA official reports on LNG terminal expansions highlight how major Texas terminals are expanding total liquefaction capacity across multiple new production trains.
For natural gas traders, commercial handovers and press releases tell only part of the story. A facility taking operational control of new liquefaction infrastructure does not automatically mean full export volumes are hitting the water.
Pipeline feedgas commissioning, cooling cycles, and initial vessel loading often proceed unevenly over several weeks before a terminal reaches steady-state export throughput.
How satellite imagery confirms liquefaction activity
Evaluating natural gas export terminals with satellite passes relies on observing multi-modal physical proxies across berths, storage tanks, and flare stacks.
Using optical imagery from the ESA Copernicus satellite constellation, analysts monitor berth occupancy, vessel staging at nearby anchorages, and carrier loading times. When combined with infrared observations, satellite passes reveal flaring intensity and thermal signatures associated with active liquefaction processes.
Short dwell times at export berths alongside reduced anchorage queues provide early evidence that new trains are operating at sustained rates rather than undergoing periodic restarts.
Connecting physical terminal activity to regional price dynamics
Physical natural gas flows directly influence Henry Hub basis differentials and international arbitrage spreads. When Gulf Coast terminals absorb additional feedgas, regional domestic pipeline oversupply can ease quickly.
Traders tracking global gas balances consult datasets like GIE ALSI European LNG tracking baselines to gauge destination inventories. However, knowing whether US export terminals are running at full tilt provides the essential supply-side confirmation.
While enterprise analytics platforms such as Ursa Space energy analytics for institutional desks offer custom monitoring for large institutions, individual traders usually lack access to six-figure subscriptions. Independent investors need accessible ways to evaluate physical energy assets without maintaining complex institutional tooling.
Satellite-backed evidence in minutes without a GIS team
Aureum bridges the gap between raw spatial data and trade decision-making. Rather than sifting through raw files or relying on stale public maps, traders can use Query to ask plain-English questions about named energy infrastructure.
To monitor key energy corridors over time, readers can follow curated Track boards that deliver structured updates when satellite passes land. This workflow yields clean, verifiable physical insights without requiring specialist remote sensing expertise.
Verify energy export flows with space-backed evidence
Join the private beta to ask plain-English questions about named physical assets or follow curated Track boards.