News
Iranian Tankers Stranded in Gulf Blockade: Satellite Verification
At least 50 Iranian crude carriers sit laden and immobile inside the Persian Gulf. Here is how satellite radar and optical observations confirm physical anchorage accumulation behind the U.S. naval blockade.
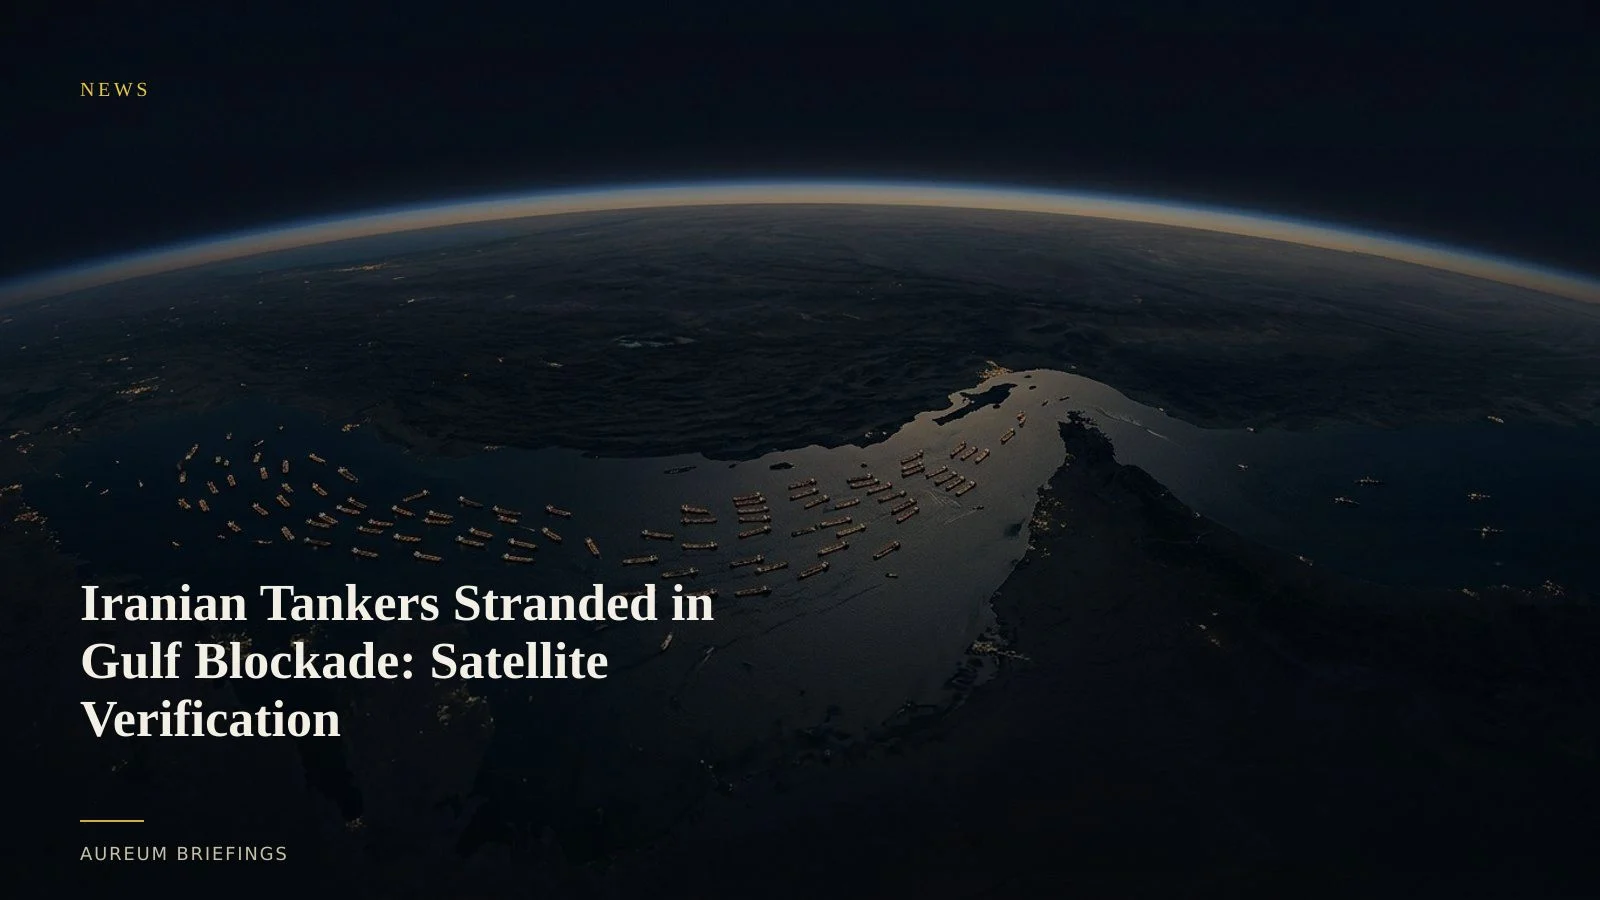
U.S. naval blockade strands 50 crude carriers off the Iranian coast
A naval blockade reinstated outside the Strait of Hormuz has left at least 50 Iranian crude tankers stranded in the Persian Gulf, according to maritime shipping updates from United Against Nuclear Iran (UANI). The U.S. Navy reinstated enforcement in the Gulf of Oman following the breakdown of diplomatic negotiations, effectively cutting off outward oil transit.
The stranded fleet represents tens of millions of barrels of heavy crude trapped in coastal anchorages near Kharg Island, Bandar Abbas, and Lavan Island. Facing interdiction outside the chokepoint, vessel operators have chosen to idle in Iranian territorial waters rather than attempt outbound passage through the Strait.
Synthetic aperture radar penetrates transponder blackouts across Gulf anchorages
Sanctions-evading tankers routinely turn off automatic identification system (AIS) transponders when staging or loading. Satellite radar and optical sensors provide unbiased verification regardless of location signal manipulation.
By utilising high-resolution synthetic aperture radar imagery from Copernicus Sentinel-1, analysts detect metallic vessel hulls through dense atmospheric haze and cloud cover. Comparing recent satellite passes against baseline anchorage counts quantifies exact vessel clusters and draft depth changes.
Optical shadow analysis on crude storage tanks at major coastal export terminals further confirms whether unrefined oil is backing up into onshore storage facilities or remaining locked onboard stranded hulls.
Reading physical accumulation before official supply prints publish
When maritime blockades enforce physical barriers, headline narratives often diverge from operational reality. Official statistics like the EIA weekly petroleum supply report register trade shifts only after customs filings or port discharges occur, introducing multi-week reporting lags.
Satellite-backed analysis evaluates whether vessels ride low in the water under heavy crude weight or float high in ballast. Measuring physical anchorage volume provides verified ground evidence of trade bottlenecks long before official data catches up.
How DIY investors verify physical trade disruptions
Institutional commodity desks pay significant sums for proprietary satellite analytics. DIY traders and independent analysts usually depend on delayed news commentary or consumer map tools that offer outdated imagery without analytical context.
Aureum fills that gap by converting raw earth observation data into clear evidence you can act on. Ask direct physical economy questions using Query, or follow curated, hand-built boards on named maritime corridors with Track.
Verify physical world market shifts with Aureum
Join the free beta today to query earth observation evidence or follow hand-built KPI boards on physical trade chokepoints.