News
Container Shipping Rates Surge: Verifying Port Dwell Times and Staging With Satellites
Ocean container freight rates are spiking across major corridors even as end-user import demand remains relatively flat. Satellite imagery reveals whether yard congestion and transshipment dwell times are driving the price volatility.
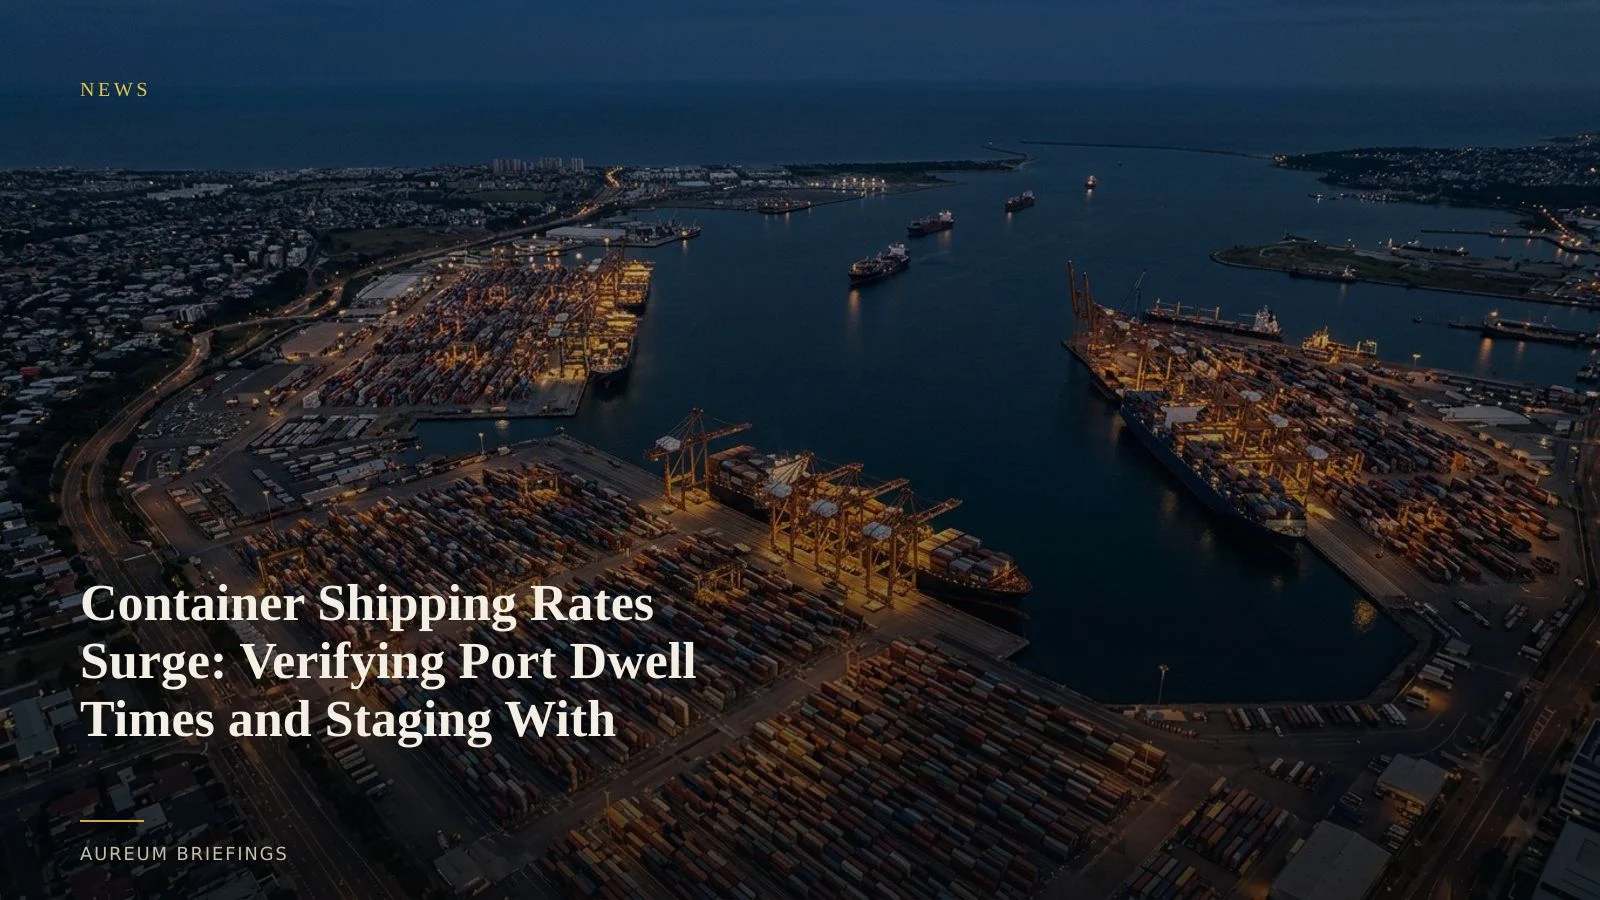
Why maritime freight rates are rising while demand stays flat
Container spot rates have climbed sharply across key trade lanes despite overall import volumes showing little change. According to recent ocean shipping market observations, elevated rate volatility is forcing traders to look beyond headline demand metrics.
When spot prices decouple from import data, physical friction across transshipment hubs is usually the cause. Official freight prints like container freight rate indexes record pricing changes after contracts settle. However, the physical bottlenecks that drive those surcharges build up days or weeks earlier at major container yards.
Measuring container stack density from orbit
Instead of relying purely on lagging market commentary, traders use optical and radar satellite imagery to inspect container staging yards directly. High-resolution optical passes capture container stack height, yard footprint expansion, and terminal gate activity at major ocean gateways.
When transshipment hubs experience operational slowdowns, container stack density rises rapidly. By tracking physical changes in yard footprint across successive satellite passes, analysts can quantify terminal saturation before carriers officially declare peak surcharges.
Piercing cloud cover at marine gateways
Coastal weather and clouds often obscure optical imagery at northern marine terminals. To maintain continuous monitoring, traders combine optical imagery with synthetic aperture radar satellite data from open space agency programs.
Radar signals penetrate cloud cover and darkness, recording metallic reflections from container gantries, stacked steel boxes, and anchored container vessels. This enables reliable measurement of container lingering times even during heavy coastal fog or night operations.
Bridging the intelligence gap for individual traders
Commodity trading desks at major financial institutions pay substantial sums for institutional satellite analytics feeds and custom vessel tracking platforms. Meanwhile, individual investors usually fall back to free web tools that only provide dated imagery without analysis.
This leaves independent traders at a distinct disadvantage when ocean freight rates reprice suddenly. Aureum bridges this gap by converting complex Earth observation data into clear, satellite-backed evidence that traders can evaluate before making a market move.
How to confirm ocean freight signals with Aureum
When market reports signal rising freight rates, start by asking Query a direct question about container yard density or vessel anchorage queues at specific import terminals.
To monitor ongoing ocean logistics risks, follow hand-built KPI boards on Track covering key maritime corridors and major ports. This combination allows you to trade based on verifiable ground truth rather than lagging narratives.
Verify ocean logistics bottlenecks yourself
Private beta is open. Ask Earth a question, or follow hand-built Track boards on key shipping corridors and terminals.