News
Port Congestion and SPR Depletion: Satellite Verification
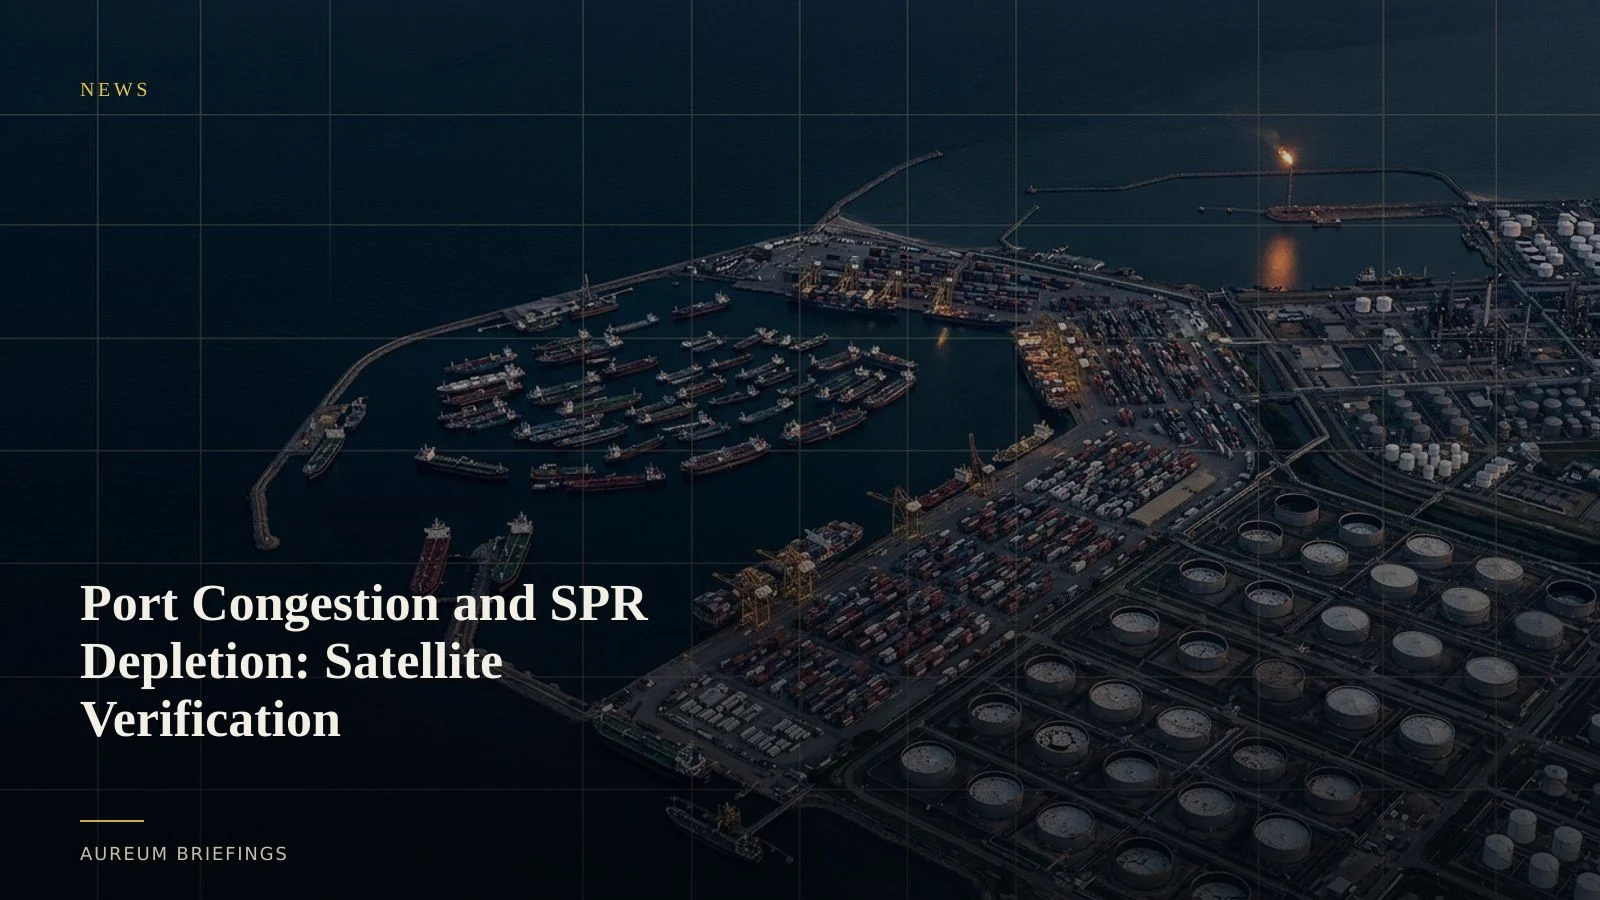
Global container shipping bottlenecks lock up 12 percent of vessel capacity as US Strategic Petroleum Reserve stocks sit at four-decade lows. Satellite observation verifies physical supply friction before official reports print.
Physical bottlenecks tighten across shipping and crude
Global trade flows are encountering simultaneous friction across container freight and government crude reserves. Fresh maritime data indicates that global container fleet congestion has absorbed 12 percent of total vessel capacity, idling container ships in anchorage queues outside major gateways.
Concurrently, policy analysis shows that US Strategic Petroleum Reserve drawdowns have left government stocks at a four-decade low, removing crucial downstream buffers as refining runs remain elevated across coastal facilities.
When vessel staging and energy reserves contract simultaneously, trade velocity slows. Verifying whether anchorage queues are easing or commercial tank farms are refilling requires direct spatial observation rather than waiting on lagging monthly reports.
Measuring container yard density and anchorage queues
Port congestion rarely signals its arrival through official press announcements. Instead, anchorage waters fill with stationary vessels while container terminal yards reach heavy stacking capacity.
Optical satellite imagery and synthetic aperture radar allow market participants to quantify vessel counts across outer anchorages regardless of cloud cover or dark AIS signals. By combining marine radar returns with optical yard analysis, observers measure container stack footprints and berth turnaround times at primary gateway ports.
Tracking crude storage roof height and terminal throughput
The drawdown in government crude reserves shifts inventory vulnerability directly onto commercial tank farms and export terminals along the US Gulf Coast. Official inventory releases provide weekly national aggregates, but they lack location-specific granularity.
High-resolution satellite imagery measures floating-roof tank shadows inside commercial storage complexes near Freeport and Corpus Christi. As roof heights drop, calculated internal volume reveals whether physical crude stocks are depleting ahead of scheduled refinery maintenance.
Integrating spatial evidence into market strategy
Institutional research desks spend heavily on specialised GIS analytics to spot maritime tie-ups and inventory shifts. For individual traders and commodity market participants without dedicated remote-sensing teams, relying on delayed text reports leaves substantial blind spots.
Aureum bridges this gap by turning Earth observation data into actionable verification. Asking plain-language questions through Query or following hand-built KPI boards on Track delivers clear physical evidence without complex software or manual GIS processing.
Access satellite verification today
Free to join during the beta. Ask questions about global supply chains, verify port bottlenecks, and monitor crude inventories.