Market Intelligence
River Logistics and Industrial Output: Satellite Tracking
Official monthly output reports describe aggregate production, but physical freight bottlenecks on key waterways determine whether finished metals and raw feedstocks actually move.
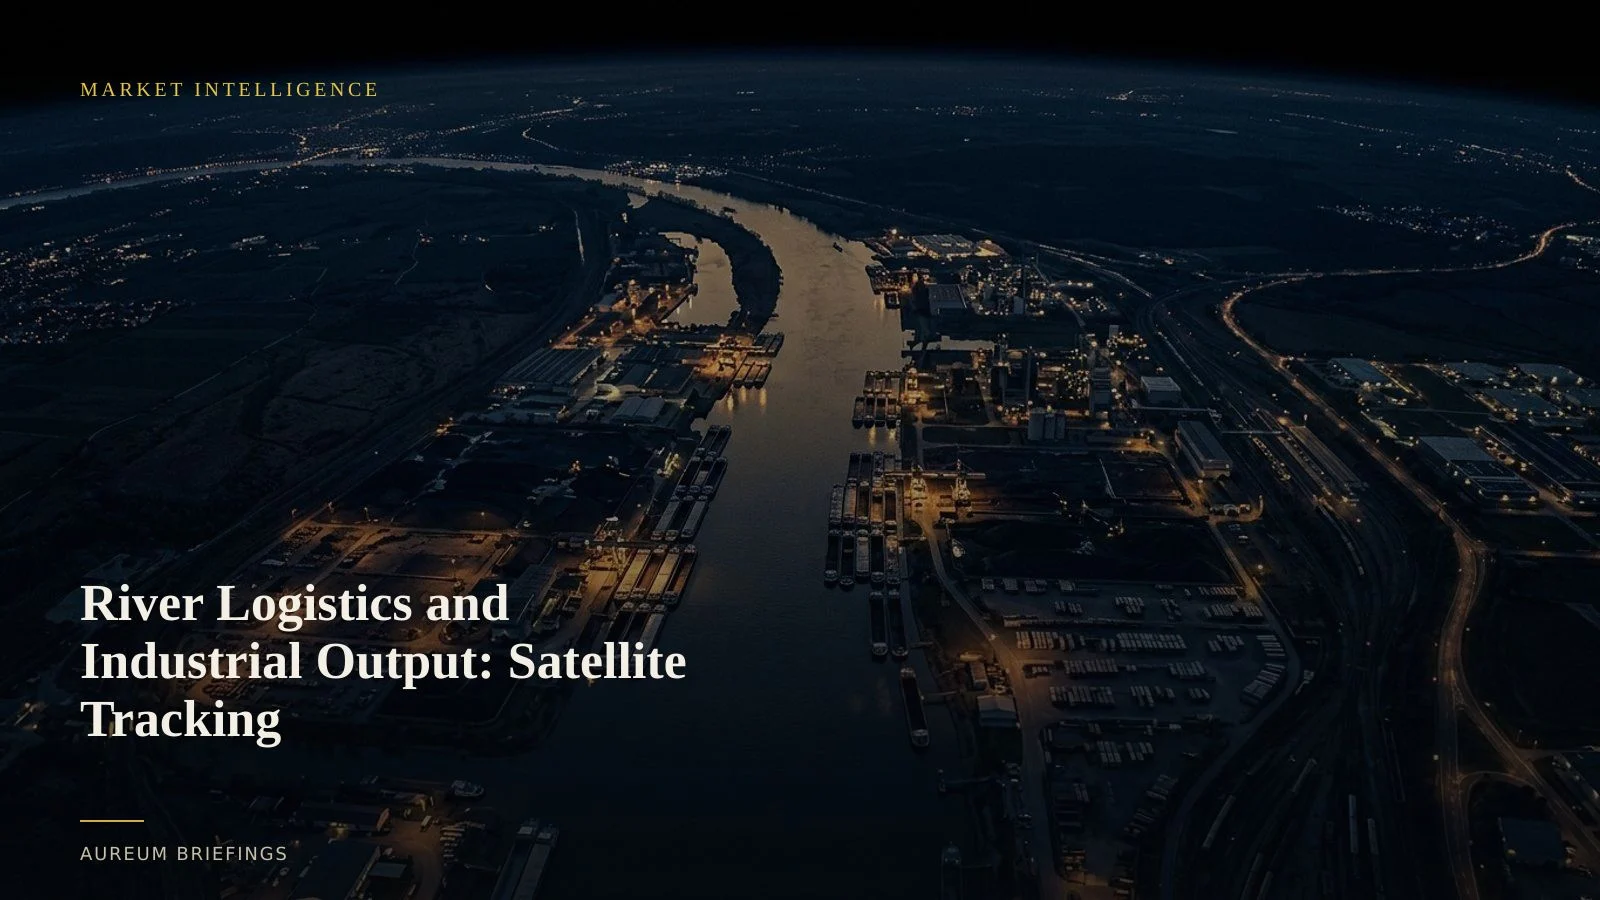
Monthly statistics hide physical transit delays
When trading commodities or equities tied to heavy manufacturing, macro updates like worldsteel crude steel production statistics provide a baseline of global capacity. However, paper output figures do not reflect whether mills can receive iron ore, scrap, and coal, or export finished coils.
Inland waterways carry a massive share of heavy industrial materials across Europe and North America. When river levels drop due to summer heat or drought, barge draught limits shrink, forcing operators to load vessels at half capacity or stop transits entirely.
By the time official trade statistics record inventory build-ups or mill curtailments, weeks have passed. Satellite imagery gives traders direct visibility into physical supply chains long before economic prints catch up.
Mapping water restrictions on critical freight corridors
Severe droughts frequently dry up crucial logistics veins across Central Europe. Recent Copernicus Sentinel-2 river imagery over the Danube highlights record-low water levels that expose sandbars and restrict barge transit north of Budapest.
For heavy industrial operators, falling river channels trigger immediate logistical friction. Refineries, steel plants, and chemical complexes relying on river berths must switch to expensive rail freight or slow down production.
Using optical imagery and synthetic aperture radar, analysts measure channel width changes, identify anchored barge queues, and track raw material stock yards at riverfront industrial sites.
Measuring physical logistics without enterprise GIS budgets
Institutional hedge funds pay six-figure sums for enterprise geospatial datasets that monitor factory yards and supply chain nodes. DIY investors and independent commodity traders are usually left relying on outdated satellite base maps or delayed news wires.
Trading using satellites does not require building an expensive internal remote-sensing team or buying raw multi-spectral tiles. It requires turning satellite coverage into direct, measurable answers about ground conditions.
When low water levels disrupt inland shipping, optical imagery tracks vessel accumulation while thermal and radar sensors monitor whether plant activity levels are adjusting to raw material constraints.
How to incorporate satellite river tracking into your process
To trade on physical economy disruptions, start with the logistics choke points that move prices. Identify river-adjacent facilities like blast furnaces, coal terminals, or fertiliser plants.
When river flow drops, check whether raw material yards at the destination facility are shrinking or if finished goods yards are piling up. Combine these observations with vessel counts at shallow river passes.
Instead of reacting to headline news after prices adjust, satellite-backed analysis confirms physical supply constraints when the event is still unfolding on the ground.
Get satellite-backed insights on physical markets
Join the Aureum beta to query earth data in plain English and track physical supply chains in minutes.