News
Supertanker Rates Top $1.4M as Route Reshuffling Ties Up Crude Fleets: Satellite Verification
Crude shipping costs have surged to record highs as Middle East geopolitical shocks and expanding sanctions reroute global crude flows. Here is how satellite radar and optical imagery verify vessel turnaround times and anchorage accumulation.
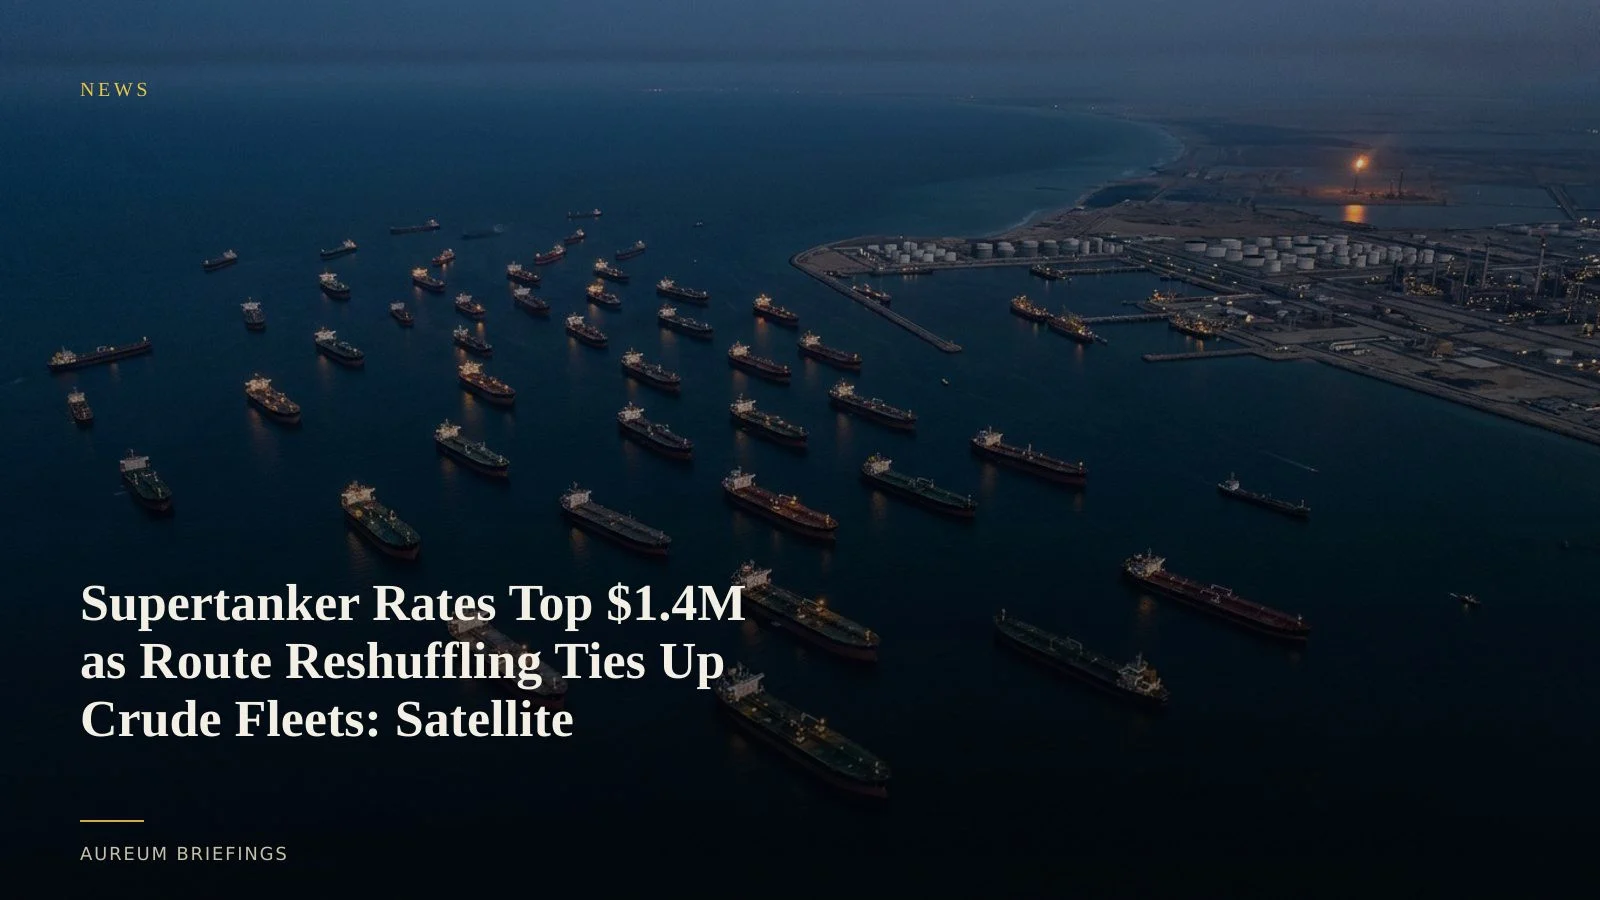
Record supertanker rates reflect structural route inefficiency
Very Large Crude Carrier (VLCC) spot rates on the Persian Gulf to East Asia route surged past $1.4 million per day in early October, shattering previous records according to VLCC crude freight rate trends reported by OilPrice. The rate spike reflects a compounding logistics bottleneck as Persian Gulf trade shifts onto longer, inefficient sea lanes.
As military conflict and geopolitical friction disrupt primary transit routes, crude buyers in Asia and Europe are forced to source alternative barrels or accept extended voyages around the Cape of Good Hope. This sharply increases ton-mile demand, effectively removing tanker capacity from the spot market without a drop in physical vessel numbers.
Sanctions friction and fleet fragmentation compound shipping tightness
The freight market stress coincides with broader geopolitical policy enforcement, including recent U.S. sanctions measures analysed in Atlantic Council sanctions enforcement reporting. Regulatory enforcement and maritime restrictions split the global tanker fleet into compliant Western tonnage and less visible dark-fleet vessels.
This division reduces the pool of available tonnage for mainstream charterers. Tankers that once completed efficient round trips now experience prolonged staging at anchorages, delayed STS transfers, and diverted itineraries that exacerbate fleet tightness across major crude exporting hubs.
Verifying physical vessel staging with spaceborne sensors
While freight rate benchmarks reflect market distress after transactions close, spaceborne sensors confirm the physical mechanics in real space. Synthetic Aperture Radar (SAR) systems like ESA Copernicus Sentinel-1 radar penetrate cloud cover and darkness to count vessels positioned in coastal anchorages.
By comparing vessel density and draft changes over consecutive orbital passes, analysts observe whether supertankers are actively loading at offshore berths or idling in floating storage. This physical observation reveals whether freight spikes stem from actual port congestion or artificial holding strategies before weekly inventory prints arrive.
How DIY traders monitor crude shipping bottlenecks
Institutional commodity desks pay six figures for specialised satellite feeds and dedicated GIS teams. Independent traders and decision-makers usually rely on lagging headlines or public AIS feeds that dark fleet tankers frequently disable.
Aureum bridges that gap by delivering structured satellite evidence directly. Use Query to ask targeted plain-English questions about specific anchorage zones, or follow Track hand-built KPI boards on key maritime chokepoints and export hubs to monitor physical trade flows before weekly freight data updates.
Verify physical commodity flows with satellite evidence
Join Aureum during the free beta to run plain-English satellite queries and follow hand-built physical economy boards.