Guide
Tracking Upstream Energy Completions With Satellites
Official energy statistics confirm supply long after crude flows into pipelines. Here is how traders measure active completions and well pad development directly from space.
The lag between physical work and official reports
Energy markets trade on expected supply, but official production prints often lag physical operations by six to eight weeks. State regulators and government agencies compile monthly completions long after sand, pumps, and water trucks leave the well pad.
While weekly benchmarks like EIA petroleum inventory reports capture storage shifts, they do not tell you which shale basins are bringing new production online this morning.
Waiting for publication means trading on historical record. Traders who evaluate physical activity with satellite-backed evidence track hydraulic fracturing crews directly from space before those wells connect to pipeline gathering networks.
What satellite observation actually sees on well pads
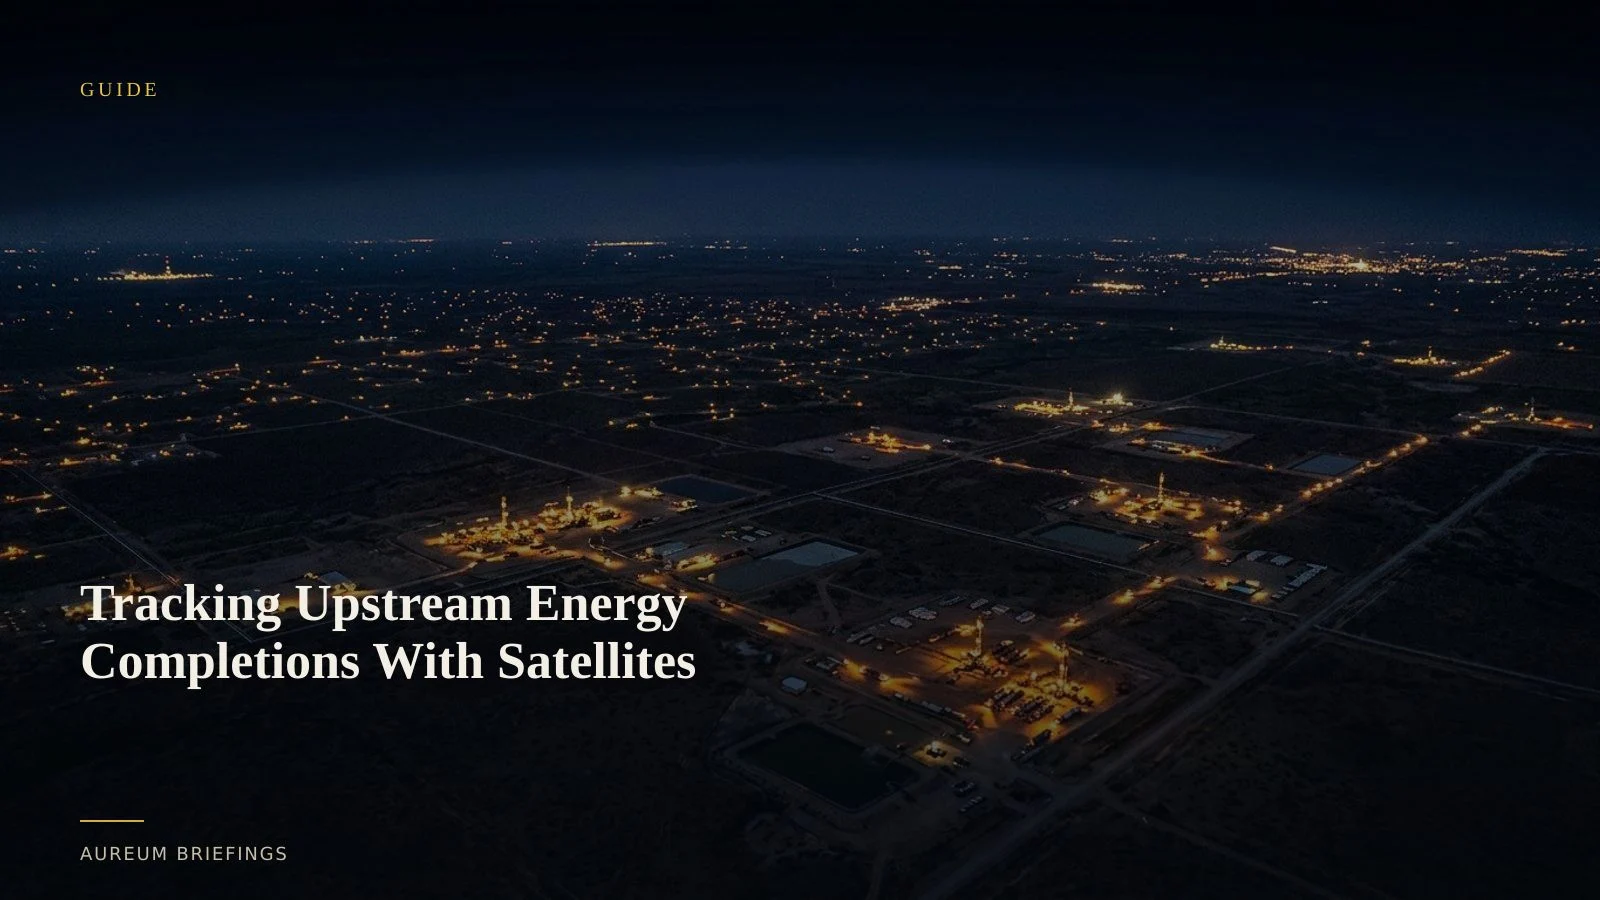
A drilled well does not produce crude or gas until it is completed. Identifying active completion requires spotting heavy equipment clusters, high-pressure pump trucks, sand haulers, and temporary fluid storage ponds.
Commodity desks can afford commercial satellite monitoring of frac crews; DIY investors usually cannot. Routine open imagery passes still help spot large pad setups and equipment clusters across remote basins when the resolution allows.
By comparing consecutive orbital passes, analysts track when equipment arrives, how long operations last, and when the pad clears for tie-in. Combining optical imagery with thermal signals from NASA FIRMS flaring indicators verifies initial gas production before official metering.
Turning imagery into supply forecasts
An institutional research desk might employ dedicated remote-sensing teams to scan basin imagery and run custom spatial models. Major alternative data analytics providers aggregate these spatial signatures into time-series indicators for capital markets.
The underlying math relies on completion duration and initial flow rates. A typical hydraulic fracturing operation runs for one to two weeks per pad. Once equipment demobilises, initial production typically begins within 30 to 60 days.
Tracking completion counts across major basins yields a reliable forecast of short-term production shifts two to three months ahead of government publication cycles.
Bridging the gap for independent traders
Independent traders often try to piece together physical context using open tools. Research guides from Bellingcat open-source investigations detail basic imagery verification, but manual visual inspection across thousands of pad locations does not scale.
Aureum bridges that gap. Instead of sifting through raw tiles or maintaining complex spatial databases, traders ask plain-English questions or monitor specific asset watchlists.
Query analyses physical changes on demand, while Track delivers continuous monitoring across energy corridors and industrial facilities.
Verify physical supply in minutes
Free to join during the beta. Query satellite evidence directly, or follow Track boards on named energy assets.