Briefing
US Gulf Coast Crude Shipments: Verifying Coastal Flows With Satellites
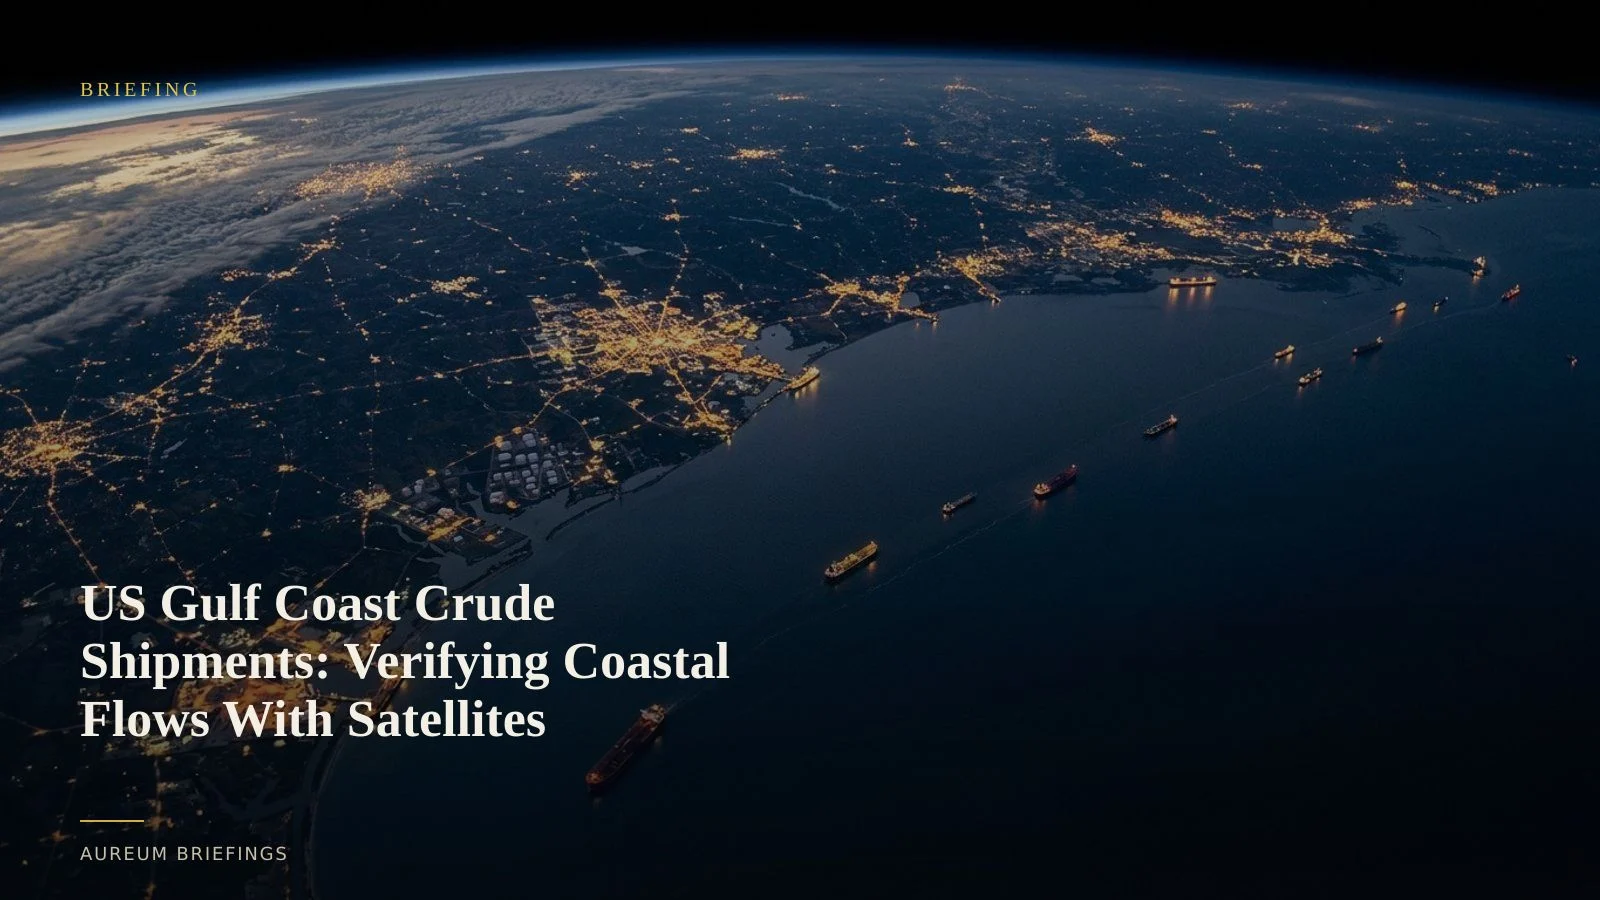
Waterborne crude and refined product transfers from PADD 3 to PADD 5 quadrupled after coastal shipping waivers. Satellite observations confirm terminal activity before official energy reports print.
When coastal oil flows surge fourfold
Domestic energy trade between American coastal regions can shift rapidly when regulatory adjustments or refinery yield demands alter transport economics. Recent data from official US waterborne petroleum reports shows that waterborne crude oil and refined product shipments from the US Gulf Coast (PADD 3) to the West Coast (PADD 5) more than quadrupled following expanded vessel transit waivers.
Shipments to the East Coast (PADD 1) also recorded marked gains during the same window. For physical commodity traders and macro analysts, these inter-district transfers directly impact regional benchmark spreads, inventory balances, and coastal freight rates.
Waiting for lagging government prints means reacting long after domestic arbitrage trades have settled. Satellite-backed analysis provides early physical verification of tanker departures and terminal loading density.
Why official energy statistics lag physical reality
Monthly government releases provide essential baseline numbers, but they suffer from built-in publication lags. By the time official statistics detail how many barrels departed Gulf Coast marine terminals for West Coast destinations, physical crude has already been discharged, refined, and priced into local benchmark futures.
Institutional trading desks spend heavily on proprietary vessel tracking and private analyst networks. Independent market participants, however, are often left assembling delayed AIS tracking fragments and headline news summaries.
Satellite observation bridges that intelligence delay. Synthetic aperture radar and high-resolution optical sensors record draft changes, berth occupation, and floating-roof tank activity across major export hubs like Corpus Christi, Houston, and Nederland as berth operations occur.
How remote sensing verifies physical volume shifts
Confirming physical inventory movement requires more than a casual glance at static imagery. Sensor arrays must distinguish between empty berths and active vessel loading while filtering out cloud cover and sea haze.
Recent advances documented in advanced hyperspectral remote sensing research highlight how spectral imaging and rapid platform observation improve environmental and land-cover classification across variable conditions.
When applied to coastal energy hubs, satellite-backed measurement measures shadow heights on floating-roof storage tanks and tracks vessel displacement at export terminals. These quantitative physical indicators allow traders to verify whether reported shipment surges represent real crude transfers or temporary logistical noise.
Levelling the physical intelligence playing field
For years, satellite-backed commodity intelligence was restricted to elite hedge funds paying hundreds of thousands of dollars for institutional GIS feeds. Individual traders and private operators had to rely on dated open-source maps or unverified market rumours.
Aureum opens this capability by turning complex satellite processing into plain-English queries and structured KPI boards.
Whether you are evaluating WTI-Brent spreads, monitoring PADD-to-PADD waterborne arbitrage, or checking refinery crude intake, you can request an answer grounded in satellite evidence without writing specialised code or managing satellite tasking.
Verify physical energy flows before the print
Private beta is open. Ask Earth a question about coastal crude transfers, or follow hand-built Track boards on critical maritime corridors.