Industrial Intelligence
Verifying Bauxite Mining and Alumina Refinery Operations With Satellites
Aluminium market pricing rests on raw bauxite extraction and alumina refining. Satellite imagery confirms mine site activity, stockpile volumes, and refinery heat signatures weeks before monthly output reports.
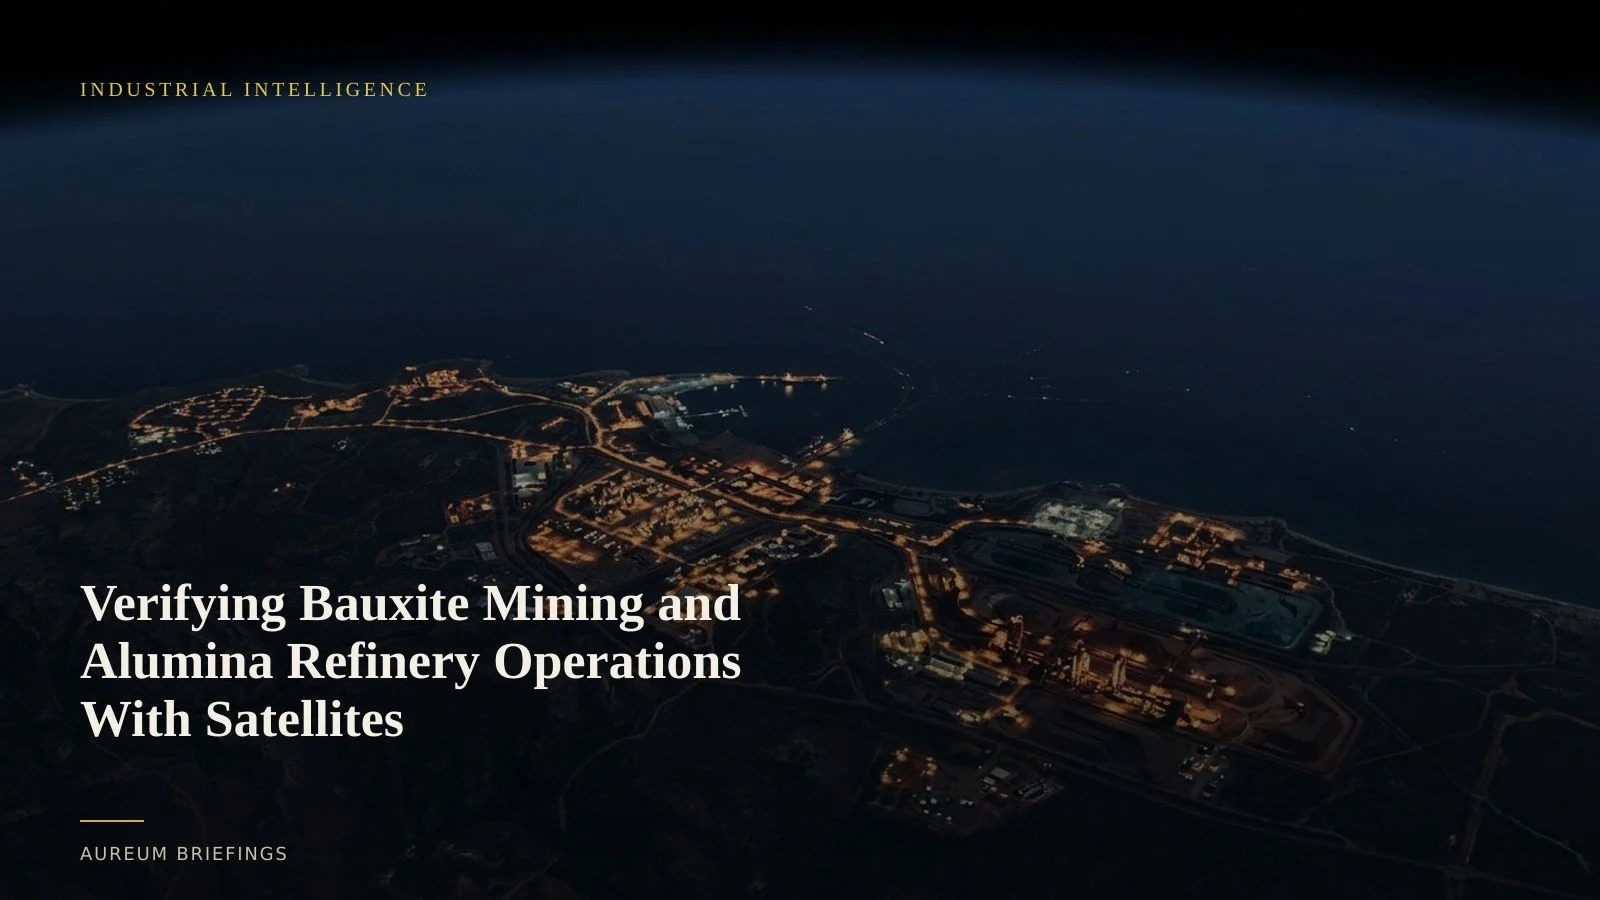
The physical choke point in aluminium supply
Primary aluminium markets depend heavily on the upstream conversion of raw bauxite ore into alumina. When bauxite supply from key mining regions in Guinea, Australia, or China suffers weather disruptions or export curbs, smelters downstream face immediate feed constraints.
Traders tracking metal supply chains often rely on delayed monthly trade releases or corporate announcements. According to primary aluminium output statistics, regional production shifts can lag physical changes on the ground by four to six weeks.
By analysing surface excavation boundaries, haul-road activity, and stockpile dimensions alongside USGS mineral survey baselines, traders can measure raw bauxite extraction directly at the pit level.
How satellite imagery measures upstream activity
Measuring bauxite production from space requires combining optical satellite imagery with radar sensors. Bauxite ore deposits feature distinct red clay pigmentation that makes excavation footprints clearly visible in multi-spectral optical passes.
During rainy seasons or heavy cloud cover, synthetic aperture radar (SAR) from platforms like ESA Copernicus Sentinel satellites penetrates cloud layers to track bulk carrier loadings at river terminals and coastal export berths.
In addition, thermal imagery measures heat dissipation from alumina refinery calcination kilns. When kilns idle or ramp up, thermal anomalies change before physical shipments hit customs ledgers.
Closing the alt-data gap for independent traders
Institutional commodity desks pay hundreds of thousands of dollars for enterprise geospatial intelligence platforms like SpaceKnow analytics tools to monitor industrial supply chains. Individual investors and independent traders have historically been locked out of these data feeds.
Most DIY investors fall back on free mapping utilities that present static, dated imagery without analysis or change detection. This leaves individual market participants trading against outdated information.
Aureum bridges this gap by delivering satellite-backed analysis on physical assets without requiring expensive enterprise subscriptions or dedicated remote-sensing staff.
A repeatable workflow for metal traders
Trading based on satellite images is not about browsing individual scenes. It is about applying a consistent framework to confirm physical supply claims.
When news indicates a mining interruption or export surge, check Query to evaluate pit expansion and terminal yard density. To track ongoing operational trends, follow hand-built boards on Track covering major refining hubs.
This satellite-backed approach gives independent traders clear evidence of raw material flows before official commodity balances adjust.
Verify physical commodity supply with Aureum
Private beta is open. Ask satellite-backed questions with Query or follow hand-built Track KPI boards.