Guide
Verifying Cement Kiln Activity and Building Material Output With Satellites
Industrial building material prints lag real-world construction trends by 60 to 90 days. Satellite thermal passes and quarry volume analysis measure clinker kiln activity directly.
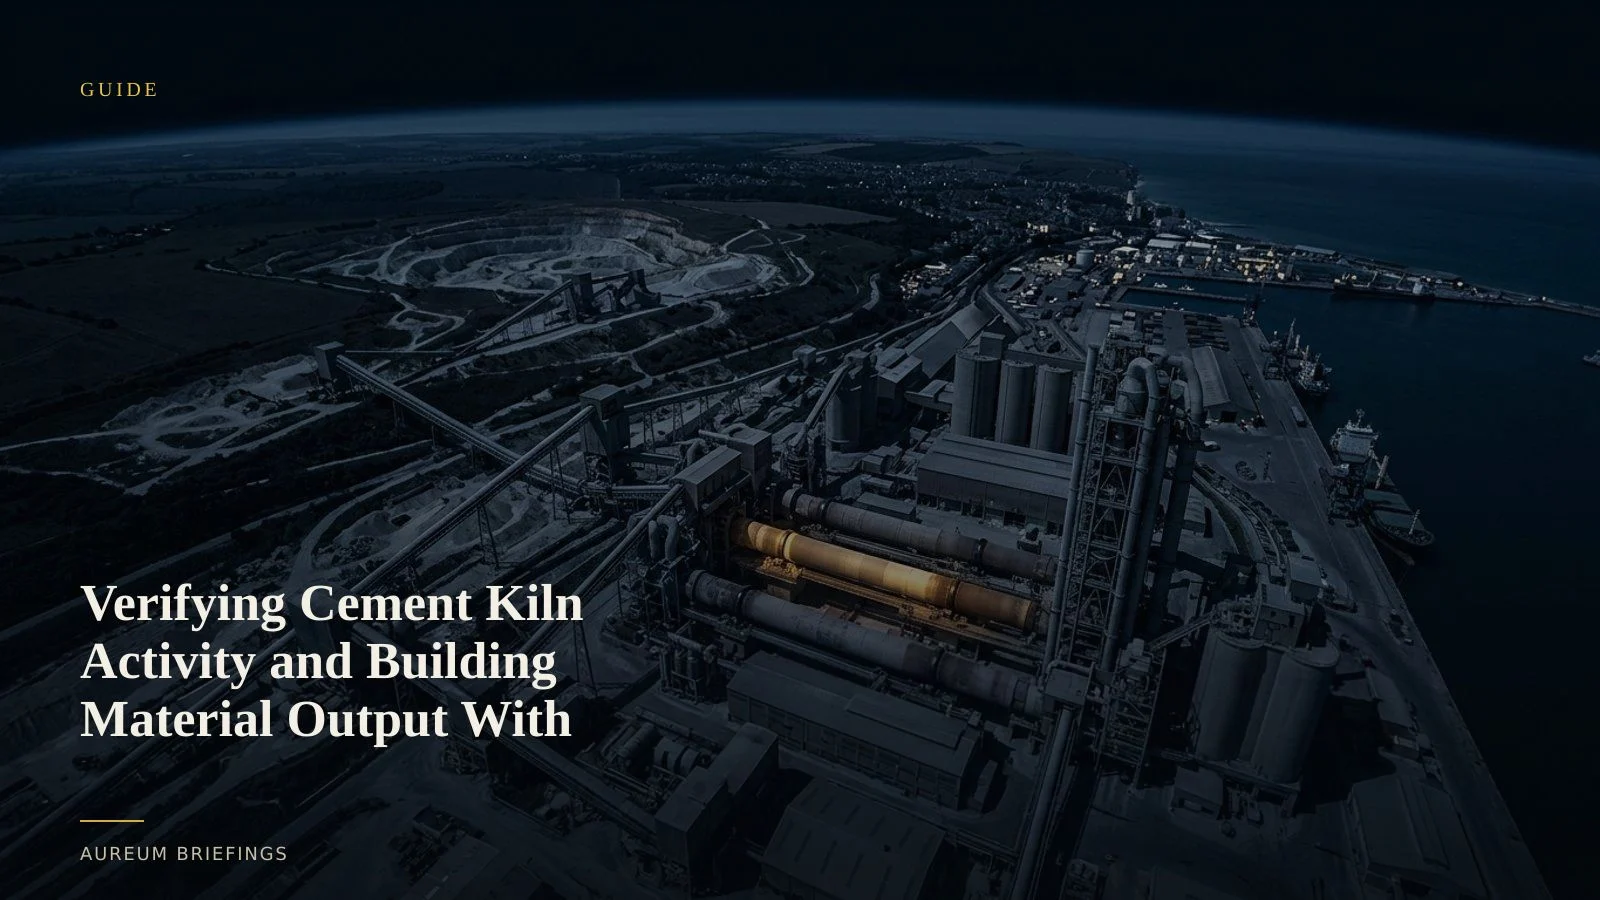
The reporting gap in industrial building materials
Cement is the primary barometer for heavy infrastructure, housing starts, and municipal capital projects. However, official production metrics from sources like the USGS mineral commodity statistics are often delayed by months.
Traders trying to price building material demand cannot rely on quarterly summaries. When infrastructure bills launch or real estate markets slow, regional cement output shifts immediately. Waiting for official survey releases means trading on old news.
By observing physical plants directly from orbit, analysts detect whether rotary kilns are running at high capacity or cooling down for unannounced maintenance.
Measuring rotary kiln heat and quarry activity
Clinker production requires massive thermal energy. Short-wave infrared and thermal sensors, including NASA FIRMS thermal detection feeds, capture heat radiated by main burner pipes and preheater towers.
When combined with optical satellite passes from ESA Copernicus Sentinel satellite passes, analysts cross-verify thermal heat signatures with raw limestone quarry excavation rates and dust coverage on conveyor structures.
A functioning plant shows persistent elevated surface heat at the kiln shell alongside active excavation patterns in adjacent quarries. An idle facility shows immediate thermal drop-offs long before trade publications report a shutdown.
Bridging institutional tools and DIY analysis
Large commodity hedge funds frequently purchase institutional data streams, such as SpaceKnow industrial indices, to monitor global manufacturing. These multi-asset feeds cost tens of thousands of pounds annually, putting them out of reach for individual investors.
DIY traders without a dedicated research desk often rely on free mapping utilities with outdated images. Searching static maps fails because historical imagery cannot show operational changes across weekly windows.
Aureum bridges this gap by providing satellite-backed answers directly. Instead of managing complex imagery pipelines or paying five-figure fees, you get plain-English confirmation grounded in verified satellite observations.
How to incorporate satellite verification into trades
To trade building materials or infrastructure equities effectively, start with specific operational questions. Focus on key production bottlenecks like clinker burning or marine export terminal loading.
Use Query when news reports claim a plant restart or supply crunch. Enter the facility name to verify whether thermal signatures and pile volumes support the market narrative.
Use Track to follow named industrial facilities and shipping corridors. Following hand-built KPI boards ensures you notice operational shifts as soon as new satellite coverage lands.
Start verifying industrial assets
Access satellite-backed analysis without expensive enterprise subscriptions or GIS software. Ask Earth a question today.