News
Verifying US Gulf LNG Exports After Corpus Christi Expansion
Cheniere Energy completed its Corpus Christi Stage 3 expansion as Middle East shipping risks compound. Satellite imagery verifies berth loading and terminal throughput before weekly export reports catch up.
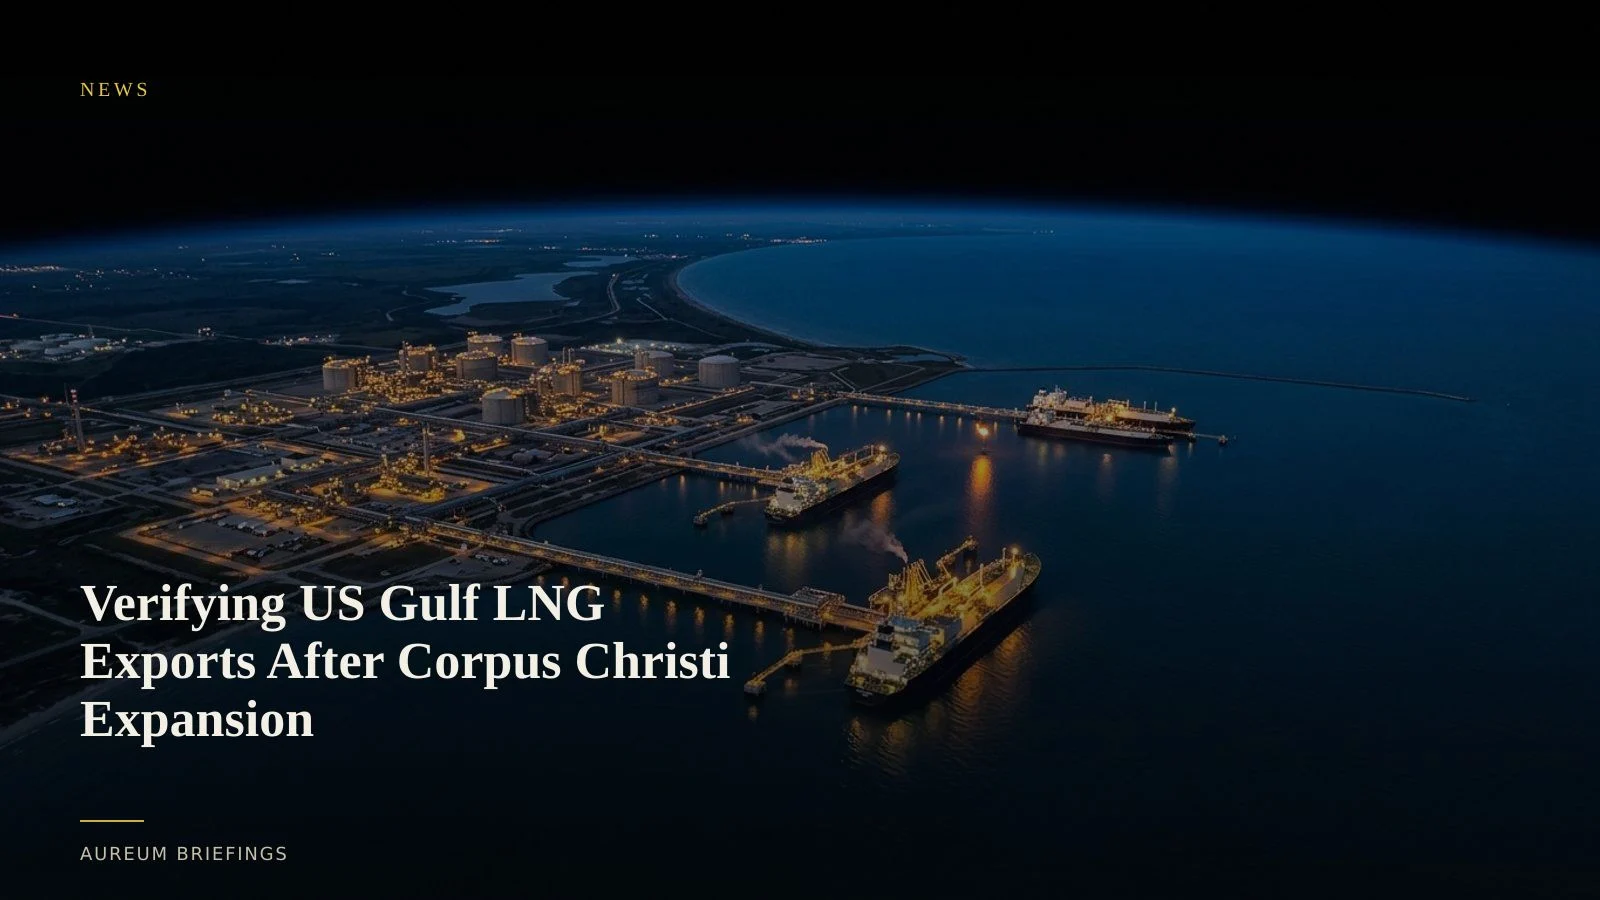
Corpus Christi Stage 3 completes as Middle East trade lanes face friction
Cheniere Energy announced the completion of its Stage 3 expansion at Corpus Christi LNG, bringing its seventh liquefaction train online and dispatching its 5,000th cargo from the Texas facility. According to Corpus Christi LNG expansion reporting, the milestone adds substantial flexible supply capacity to the Atlantic basin.
The expansion arrives as compounding geopolitical friction in the Middle East threatens traditional energy transit routes. Analysis from the Atlantic Council regional economic assessment highlights how rising freight, insurance, and transit costs across the Gulf are reordering global gas flows toward North American exporters.
However, corporate press announcements alone do not tell commodity traders whether a newly commissioned facility is running at peak capacity or encountering berth bottlenecks. Verifying physical export volumes requires direct observation of terminal activity.
How satellite imagery confirms physical liquefaction and berth throughput
To confirm whether headline liquefaction capacity converts into physical waterborne exports, analysts track two primary physical indicators: carrier berth occupancy and facility flare activity.
Optical imagery from ESA Copernicus Sentinel satellites provides regular passes over the Corpus Christi ship channel. Traders measure berth turnaround times by observing carrier positioning at loading jetties alongside shadow patterns cast by liquid storage tanks.
When cloud cover or night conditions obscure optical sensors, Synthetic Aperture Radar (SAR) detects metallic vessel hulls moored at terminal docks. Combined with thermal observations of liquefaction train operations, satellite analysis provides early physical proof of export ramp-ups long before customs prints release.
Why DIY investors need direct physical evidence
Institutional trading desks frequently subscribe to expensive terminal intelligence feeds from enterprise providers such as Ursa Space satellite analytics. Independent traders and SMB market participants, by contrast, often rely on lagged headlines or public AIS feeds that miss signal gaps during complex docking manoeuvres.
When natural gas futures move on capacity announcements, relying solely on delayed government data like EIA natural gas weekly reports exposes traders to announcement lag. Satellite-backed analysis confirms whether operational throughput matches headline claims.
By evaluating orbital passes across successive satellite orbits, traders can verify whether Texas terminals are maintaining continuous loading schedules or facing operational disruptions.
Using Aureum to track global LNG market rebalancing
Aureum bridges the gap between raw Earth observation feeds and trading decisions. Rather than navigating complex GIS tools or purchasing raw imagery scenes, traders can use Query to ask targeted questions about physical export infrastructure in plain language.
For ongoing asset tracking, Track enables users to follow hand-built KPI boards on key maritime corridors, export terminals, and industrial assets updated as new satellite coverage lands.
As global energy trade routes adjust to supply expansions in Texas and ongoing risks across the Middle East, satellite-backed verification ensures your trading decisions remain grounded in physical facts.
Inspect physical energy flows with Aureum
Private beta is open. Ask Earth a question via Query, or follow hand-built Track boards on strategic energy infrastructure.