Industrial Intelligence
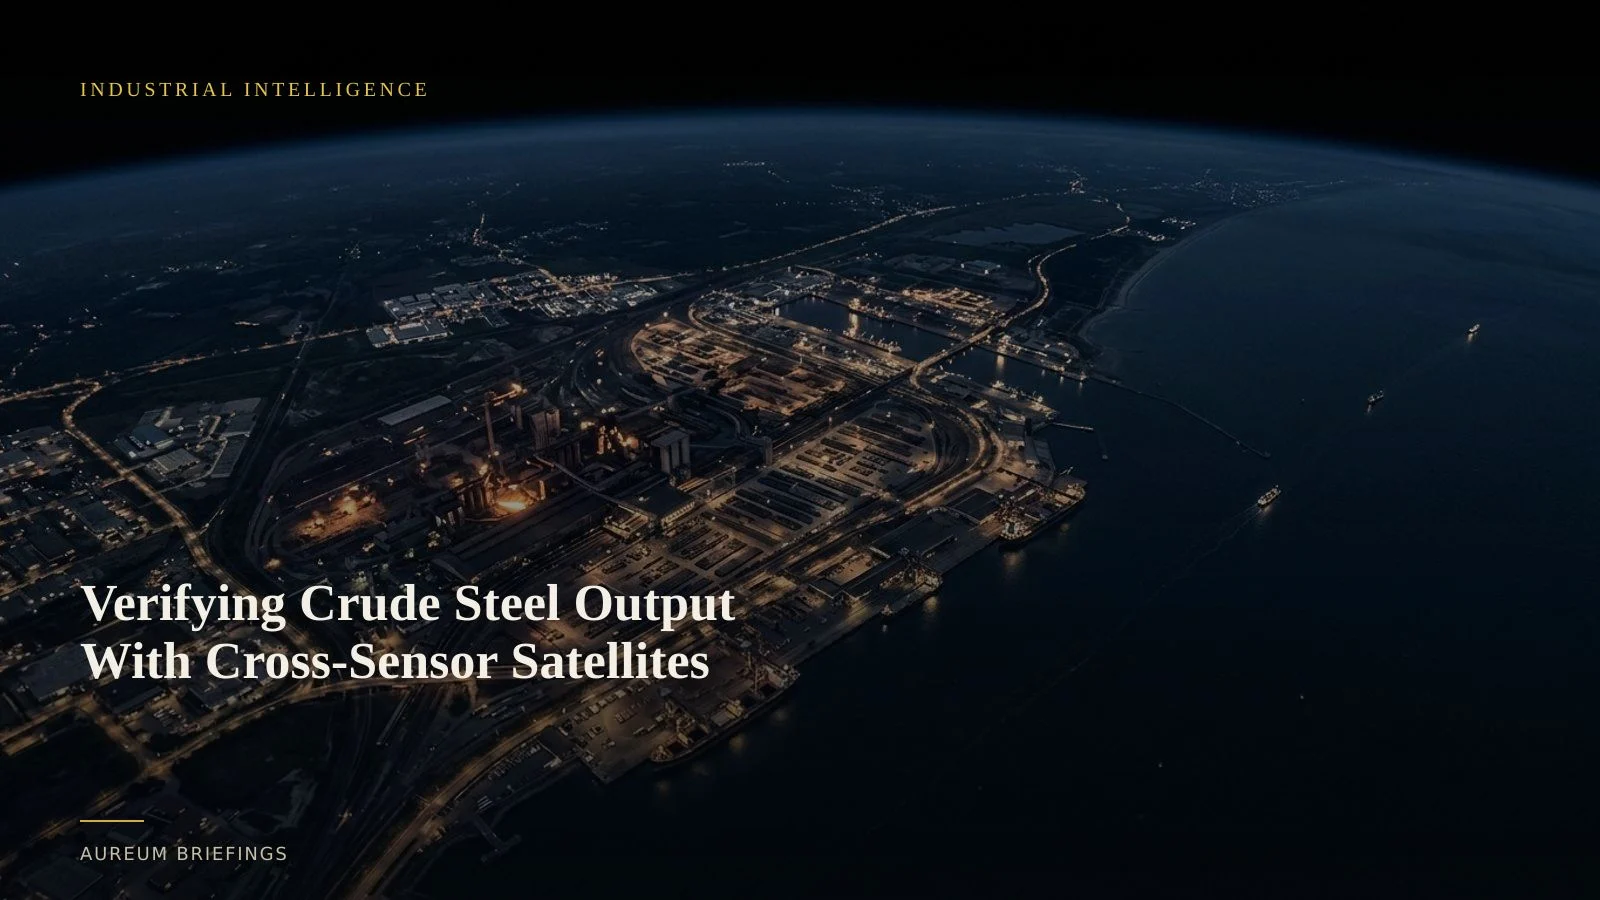
Verifying Crude Steel Output With Cross-Sensor Satellites
When global crude steel production drops, official industry prints lag physical plant activity by weeks. Cross-sensor satellite analysis reveals industrial mill shifts before market data updates.
Official steel reports lag the ground truth
When global industry bodies publish monthly figures showing crude steel output contracting, futures markets adjust to the news. For traders holding positions in iron ore, coking coal, or hot-rolled coil, reacting to published summaries means trading on old data.
Official industry prints aggregate self-reported figures across dozens of nations, introducing weeks of reporting delay. Physical steel production changes happen long before national balance sheets publish.
Blast furnaces, electric arc facilities, and scrap storage yards change physical activity before monthly statistics capture the trend. Satellite-backed analysis provides a direct window into those operational shifts.
How cross-sensor satellites track industrial yards
Tracking a heavy industrial facility requires more than taking a single visual snapshot. Steelworks combine hot metal production, raw material piles, finished coil storage, and slag disposal across hundreds of acres.
Recent cross-sensor remote sensing research highlights how combining different satellite platforms solves complex land-cover and industrial inventory challenges.
Multispectral sensors like ESA Copernicus Sentinel-2 provide spatial resolution and red-edge spectral bands that clearly outline storage yard boundaries and vehicle staging. Hyperspectral sensors further refine spectral separability between bare ground, slag heaps, and metallic scrap piles.
Why spectral separability matters for commodity analysis
A simple visual satellite image can confuse bare soil with iron ore piles or recycled scrap storage. Satellite-backed analysis relies on measuring subtle spectral differences across specific wavelength bands.
Cross-sensor satellite integration prevents misidentifying yard inventory. Hyperspectral data isolates subtle surface compositions, while frequent multispectral passes track surface area changes over time.
When global output contracts, as reflected in recent worldsteel global crude steel statistics, satellite imagery confirms whether specific regions curtailed operations or simply built up unsold inventory.
How Aureum delivers physical intelligence
Institutional trading desks spend millions building proprietary satellite processing pipelines to measure factory yards and port stockpiles. Individual traders and decision-makers are usually left with static satellite maps that are months out of date.
Aureum bridges this gap. Query allows you to ask targeted questions about physical assets and receive structured evidence backed by recent satellite passes.
For ongoing market thesis tracking, Track provides curated, hand-built KPI boards covering critical industrial corridors and commodity sites so you can follow physical trends as coverage lands.
Reading physical trends in plain English
This capability is designed for anyone who trades or decides on the physical economy: commodity traders, macro investors, supply chain operators, and independent market analysts.
Instead of waiting for lagging monthly prints, you can confirm whether raw material imports match plant output claims. You get clear satellite evidence in minutes without writing custom remote-sensing code.
Start tracking the physical economy
Join Aureum during our free beta to ask satellite questions or follow hand-built KPI boards on named global sites.