Briefing
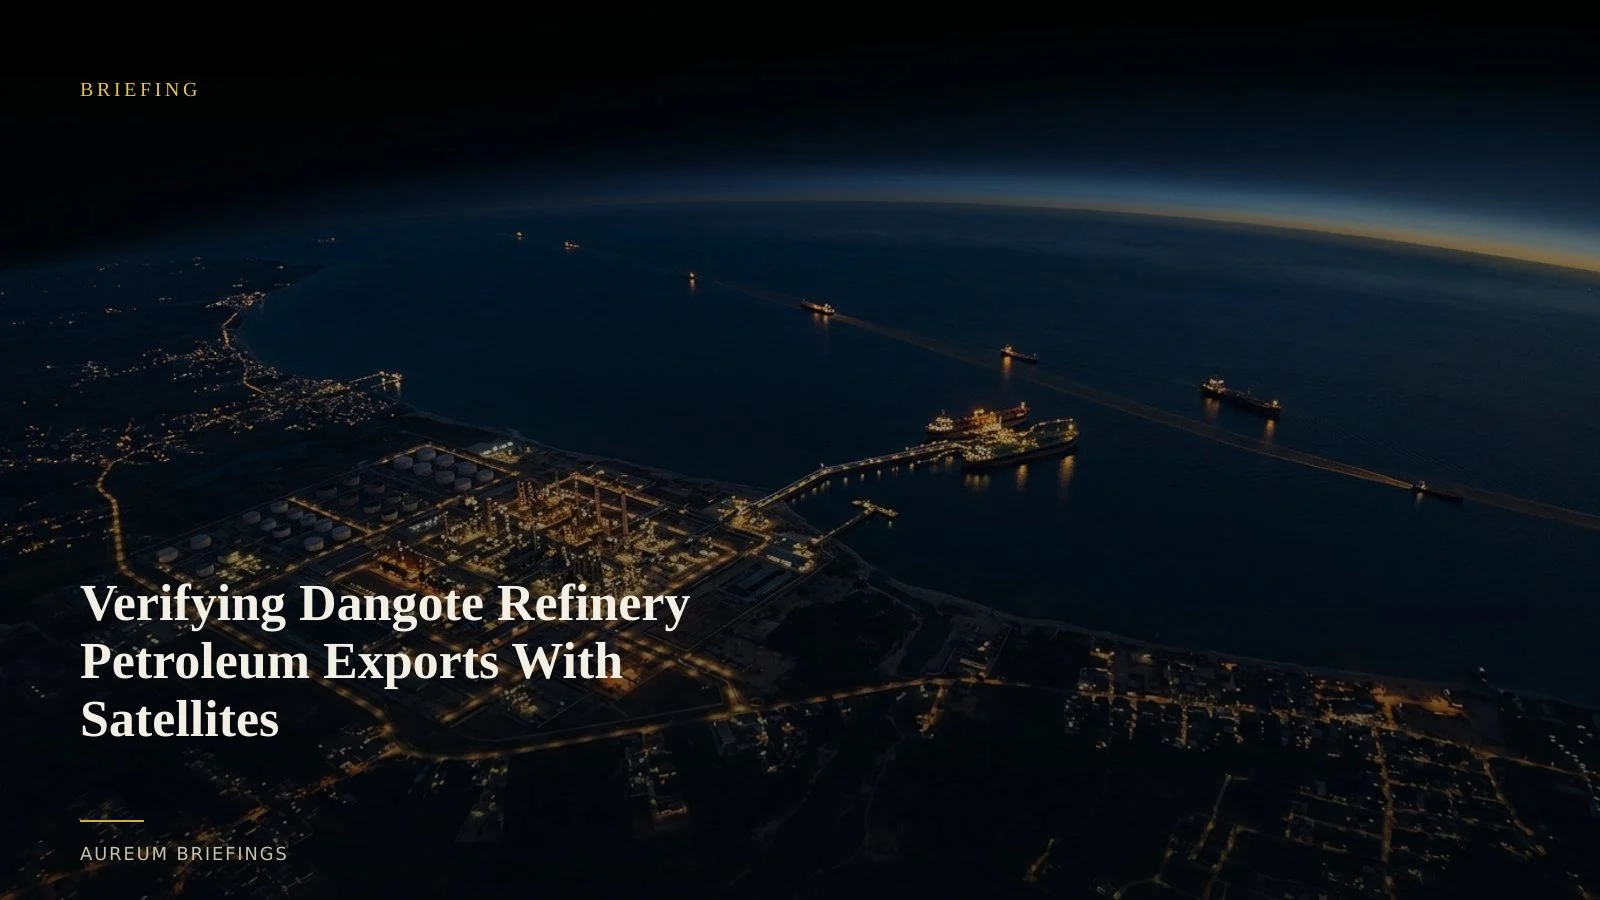
Verifying Dangote Refinery Petroleum Exports With Satellites
Seaborne petroleum exports from Nigeria have grown seven-fold as the 650,000 barrel-per-day Dangote refinery scales up. Here is how satellite intelligence confirms physical product flows before official statistics arrive.
A fundamental shift in West African petroleum flows
Data from EIA petroleum export reports shows that seaborne petroleum product exports from Nigeria have expanded seven-fold since 2023. The commissioning of the massive Dangote refinery in Lekki has turned a historically crude-exporting and product-importing nation into a major regional exporter of clean petroleum products.
For commodity traders and energy analysts, this shift fundamentally alters West African and Atlantic basin trade balances. However, official customs prints and government trade releases lag physical shipments by several weeks, leaving market participants reliant on vessel AIS feeds that are easily obscured or incomplete during offshore transfers.
What satellite sensors detect at Lekki
Verifying whether a mega-refinery is operating at capacity requires looking beyond corporate press releases. Satellite observation focuses on three key physical indicators across the facility and its marine terminal.
First, shortwave infrared and thermal satellite sensors capture flaring intensity and process unit activity across distillation and cracking units. Second, optical imagery measures shadow lengths on floating-roof storage tanks to quantify crude feedstocks and finished product inventories. Third, synthetic aperture radar (SAR) monitors vessel activity at the offshore SPM berths, identifying tanker draught changes before and after loading.
How to track refining throughput without a research desk
Institutional commodity desks historically relied on enterprise crude storage analytics tools costing tens of thousands of dollars per month to monitor key refining hubs. Retail traders and independent investors were left with static web maps or raw, uncalibrated imagery.
Using open satellite data from ESA Copernicus satellite imagery, traders can observe optical changes in tank farms and berth occupancy. However, raw imagery requires manual cloud filtering, geometric correction, and temporal baseline comparisons to yield meaningful numbers.
Aureum simplifies this process by delivering satellite-backed answers directly. Instead of managing complex GIS pipelines, traders query physical sites and track verified activity metrics in minutes.
Turning physical evidence into trading decisions
When global fuel supplies are constrained, knowing whether a 650,000 bpd refinery is operating at partial or full throttle provides a clear market edge. Satellite-backed measurement reveals if finished product inventories are accumulating on site or actively clearing through marine berths.
By combining verified tank fill rates with coastal tanker positioning, investors can evaluate Atlantic basin distillate spreads before weekly trade statistics confirm the volume.
Track physical energy flows with Aureum
Private beta is open. Ask Earth a direct question with Query, or follow hand-built Track boards on critical energy corridors.