News
Verifying Defence Supply Chain Expansion With Satellites
Escalating tit-for-tat strikes in the Gulf are depleting precision munition stockpiles. Satellite analysis provides physical proof of manufacturing buildouts long before quarterly corporate disclosures print.
Conflict escalation drains precision missile stocks
Recent tit-for-tat military actions across the Gulf have led to fresh maritime hazards, including two massive crude oil slicks drifting off Oman reported by maritime shipping news coverage. Beyond immediate shipping risks, the sustained engagement is consuming allied interceptors and strike munitions at an unprecedented rate.
An Atlantic Council analysis on munition stocks highlights that replenishing precision US missile inventories used in Middle East operations could take years. This supply crunch directly impacts defence primes, aerospace sub-tier suppliers, and global security commitments.
For equity traders and commodity investors, official guidance from defence contractors often lags actual factory output by months. Waiting for quarterly earnings filings leaves market participants exposed to narrative surprises.
Measuring industrial throughput from orbit
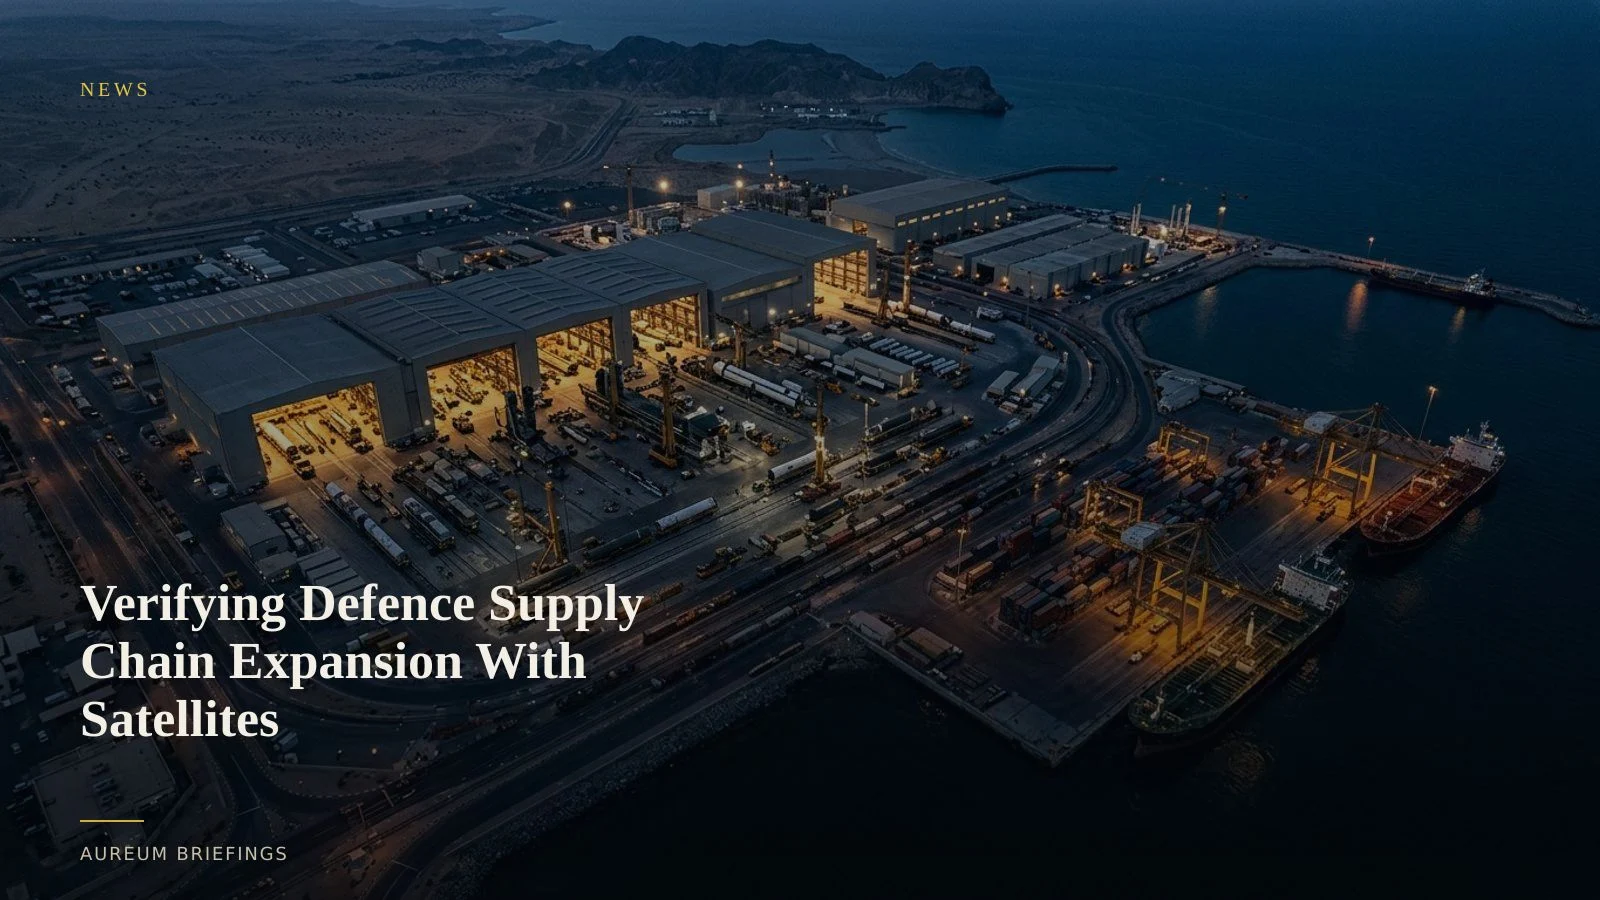
Monitoring defence manufacturing facilities does not require sub-metre espionage imagery. Traders track heavy industrial footprint changes, assembly hall expansions, logistics yard utilisation, and specialised shipping container movements using public constellation data.
Through open Earth observation programs like European Space Agency Sentinel radar data, analysts evaluate whether suppliers are actively staging completed assemblies or facing severe component bottlenecks.
When a missile assembly campus expands its staging pads or alters its thermal signature, space-based imagery detects the shift weeks before government procurement logs confirm a production surge.
Separating production headlines from physical reality
Large defence contractors routinely announce multi-billion dollar replenishment contracts during geopolitical crises. However, contract awards do not equal immediate delivery throughput.
Satellite-backed analysis reveals the physical pace of plant scaling. By measuring new construction ground-clearing, delivery truck traffic densities, and staging yard storage volumes, traders can verify whether facility expansions are operational or delayed.
This physical verification protects investors from overestimating short-term delivery velocity when supply chain friction or raw material shortages restrict factory lines.
Bridging the intelligence gap for independent traders
In the past, tracking specialised industrial supply chains required institutional research desks with six-figure geospatial analytics subscriptions. Institutional funds paid heavily for proprietary plant activity indices.
Today, independent investors can run the exact same physical checks. By combining plain-language queries with satellite evidence, traders verify contractor claims before taking positions in aerospace equities or defence metals.
When corporate executives claim ramped production, satellite imagery provides the ground truth check on whether assembly lines are actually shipping finished units.
Land your analysis on Aureum Query and Track
Instead of spending hours sifting through raw satellite imagery portals or dated map tools, Query turns targeted physical economy questions into clear, evidence-backed answers in minutes.
For ongoing monitoring across key logistics corridors and commodity hubs, Track allows investors to follow hand-built KPI boards that monitor physical output across global trade lanes.
Whether evaluating defence supply chains or energy flows, satellite intelligence removes guesswork from physical market analysis.
Confirm physical reality before the market reacts
Private beta is open. Ask Earth a question with Query, or follow hand-built Track boards on critical industrial sites.