Briefing
Verifying Fertiliser Production and Ammonia Plant Output With Satellites
Nitrogen and phosphate fertiliser markets move rapidly when plant outages or gas curtails hit physical supply. Here is how traders verify synthetic ammonia and fertiliser production using satellite-backed analysis.
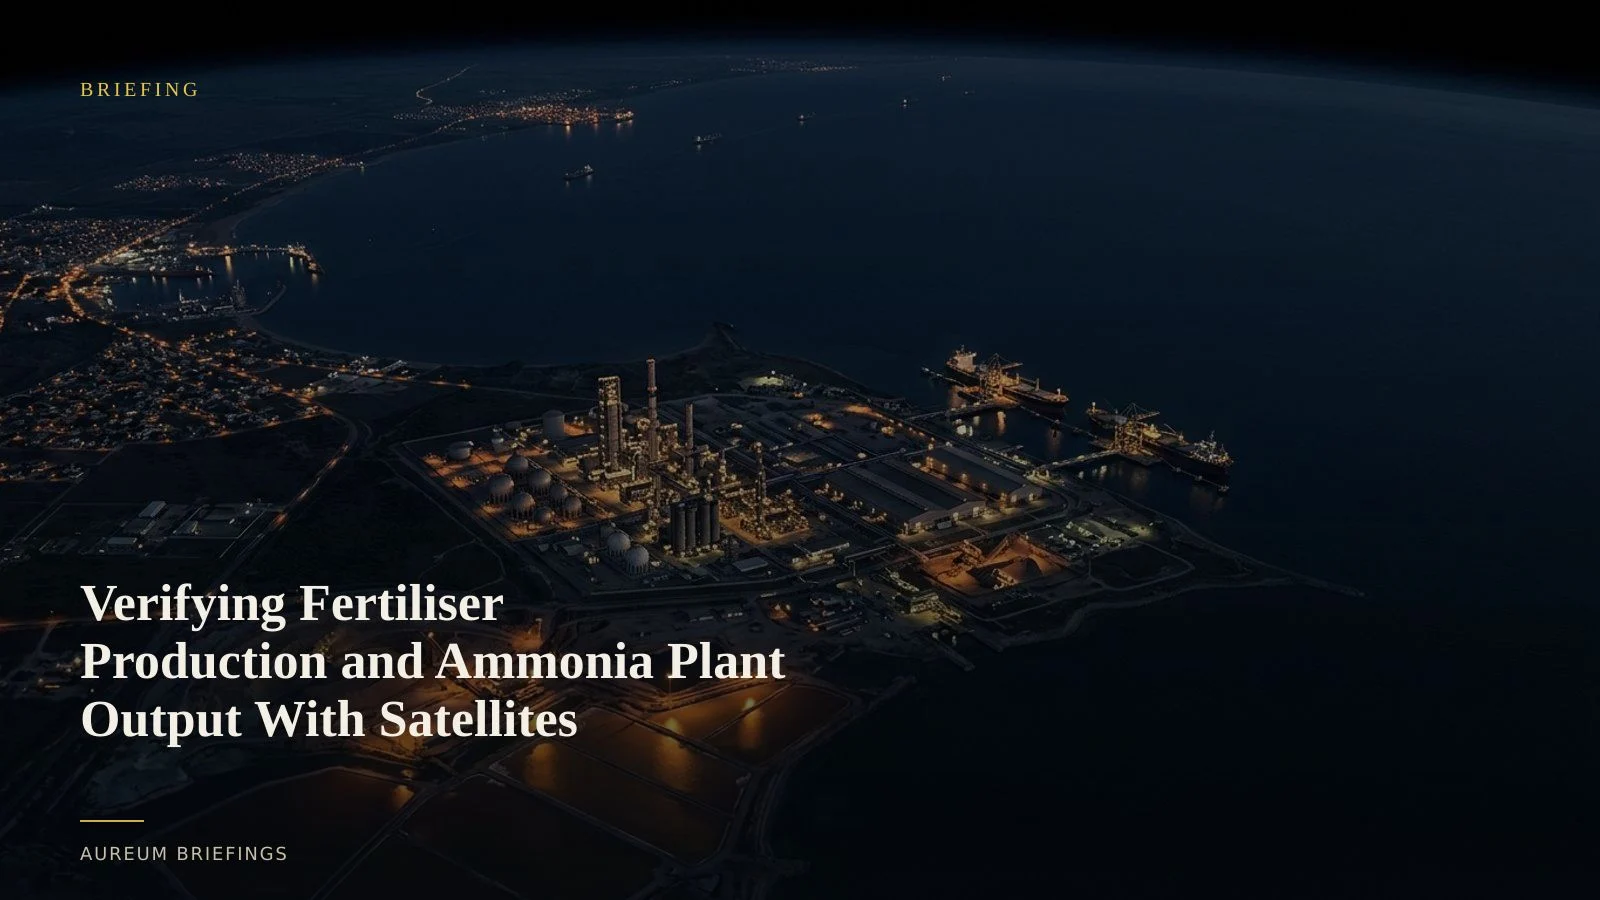
Official trade prints lag fertiliser market reality
When natural gas price spikes force European ammonia plants to curtail output, or when export quotas restrict global supply, official trade reports lag by weeks. Agricultural traders waiting on agricultural supply and demand estimates often make pricing decisions based on outdated supply figures.
Ammonia synthesis is the core building block for synthetic nitrogen fertilisers. Because manufacturing ammonia requires high temperatures and continuous natural gas feedstocks, physical plant activity leaves distinct environmental signatures that space-borne sensors detect before trade groups publish monthly volumes.
Measuring facility activity at the plant level provides an independent check on physical supply.
Measuring thermal signatures and flaring at ammonia plants
Thermal sensors and atmospheric monitoring provide physical proof of plant operating status. Operational ammonia facilities produce elevated infrared signatures around reformer furnaces and synthesis loops.
By analysing multispectral thermal observations from open Earth observation programmes alongside shortwave infrared data, traders confirm whether a facility is actively processing feedstock, running at reduced capacity, or undergoing unannounced maintenance shutdowns.
Additionally, tracking flaring activity via satellite thermal fire monitoring helps distinguish operational upsets and safety venting from routine continuous production.
Tracking port storage yards and dry bulk export queues
Beyond primary chemical production, physical fertiliser supply chains rely heavily on bulk handling terminals. Covered storage warehouses, open-air staging areas, and bulk carrier berth occupancy provide critical signals on export momentum.
Satellite radar and optical imagery allow observers to monitor vessel queues at dedicated export ports and track bulk carrier loading timelines. Cross-referencing port vessel density with global agricultural monitoring data helps verify whether domestic supply constraints are bottlenecking global exports.
A streamlined workflow for DIY commodity traders
Institutional research desks can spend heavily on custom enterprise satellite feeds and dedicated imagery platforms. DIY traders and independent analysts usually fall back to free tools that offer dated imagery without rigorous physical measurements.
Aureum bridges this gap by turning satellite data into clear, actionable evidence. With Query, traders ask natural-language questions about specific facilities and receive physical evidence backed by recent satellite observations.
For recurring monitoring of key logistics corridors and industrial hubs, Track offers hand-built KPI boards that track physical changes as new coverage becomes available.
Start tracking physical commodity supply
Join the private beta to run satellite-backed questions on industrial facilities, ports, and global energy infrastructure.