Guide
Verifying Grain Storage and Elevator Operations With Satellites
Agricultural supply reports often arrive weeks after the harvest moves. Here is how traders measure physical grain elevator activity and storage staging with satellite intelligence.
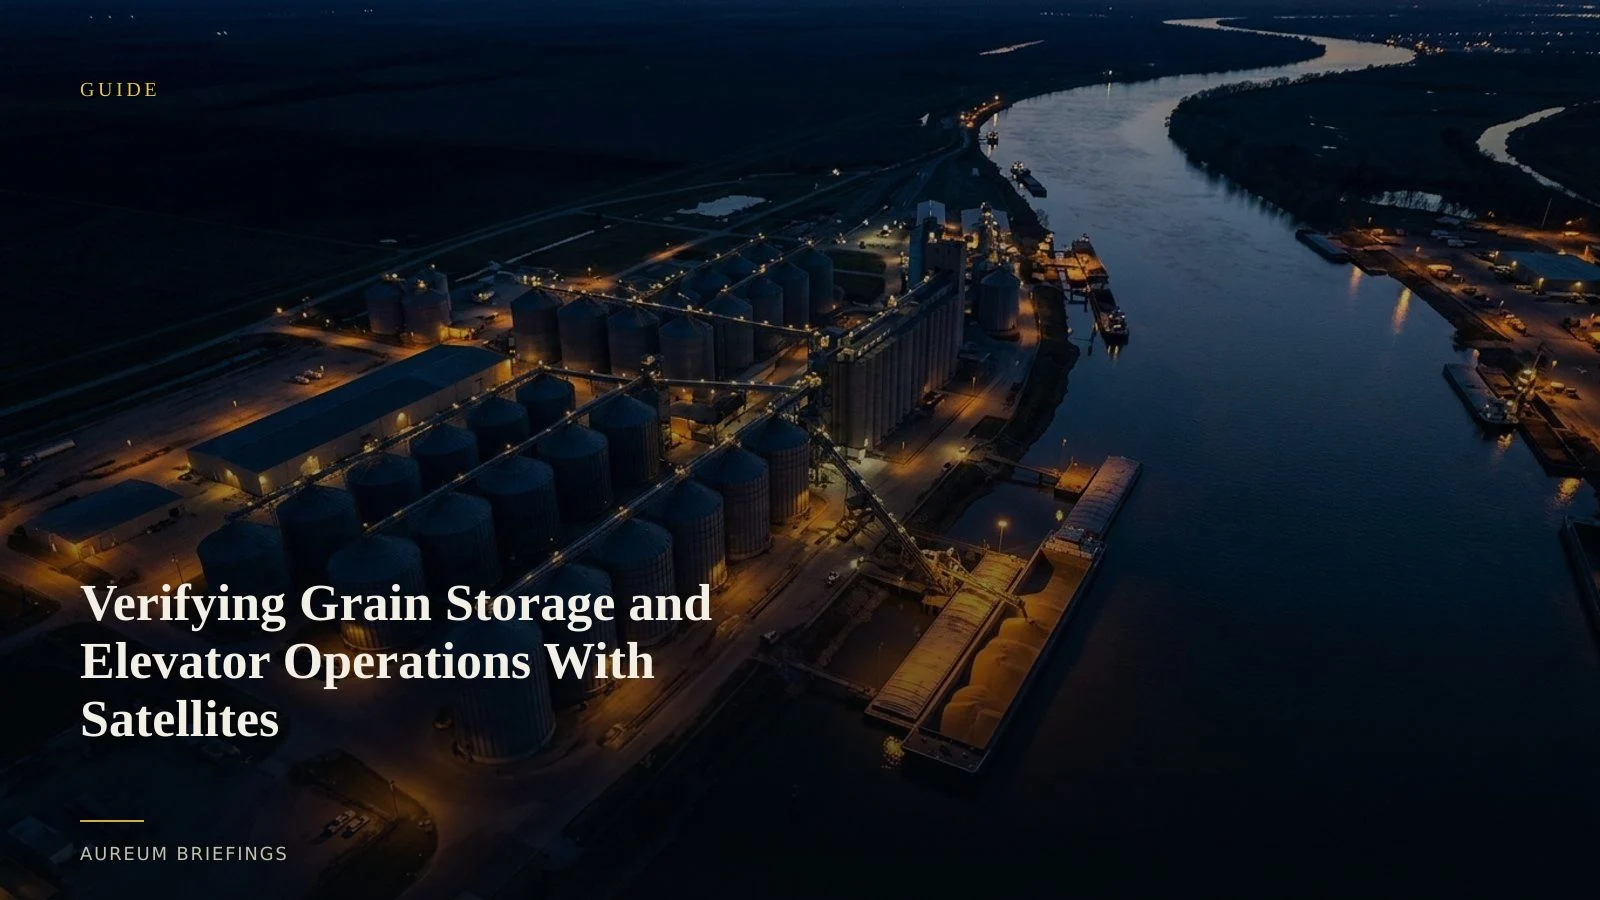
The gap between field harvest and official survey prints
When grain markets react to government yield estimates, the underlying crop has usually already left the field and entered regional elevator networks.
Official monthly releases like USDA WASDE crop reports rely on grower surveys and statistical sampling. By the time those numbers hit the wire, regional basis differentials have often shifted based on physical grain movement.
Measuring terminal elevator storage and rail car staging fills that gap before official revisions confirm what occurred on the ground.
How satellite imagery tracks grain storage staging
Grain silos and flat-storage concrete pads leave distinct physical footprints that optical and synthetic aperture radar sensors capture during regular passes.
Using open satellite data from ESA Copernicus Sentinel imagery, analysts evaluate changes in outdoor pile surface area, bunker bag placement, and barge loading queues along inland river corridors.
While large institutional firms pay six figures for custom imagery pipelines, independent traders can use satellite-backed answers to check physical volumes without maintaining a dedicated remote-sensing team.
Corroborating drought conditions with river logistics
Drought impact goes beyond dry soil. Low water levels on major river arteries quickly stall barge logistics and back up country elevators.
Cross-referencing climate indicators from US Drought Monitor tracking with barge queue counts at lock bottlenecks reveals whether harvest grain can actually reach export terminals.
When inland waterways restrict draft depths, satellite passes show grain accumulating at country elevators long before export facilities report supply shortfalls.
Integrating physical evidence into trading decisions
International agencies like AMIS grain market monitoring balance global food security data, but traders need local asset-level granularity to price near-term supply.
Combining satellite-backed observations of river barge staging with regional elevator yard activity provides a clear picture of crop flow velocity.
Rather than guessing how drought or harvest delays affect cash basis, traders gain direct physical confirmation of where bulk agricultural commodities are stalled or moving.
Access satellite intelligence for physical commodities
Join the Aureum private beta to ask plain-English questions about agricultural supply chains and follow hand-built physical trackers.