Guide
Verifying Metal Smelter Restarts and Activity With Satellites
When refining capacity shuts down or ramps back up, market consensus lags physical reality by weeks. Here is how space-based observation verifies furnace status before official reports publish.
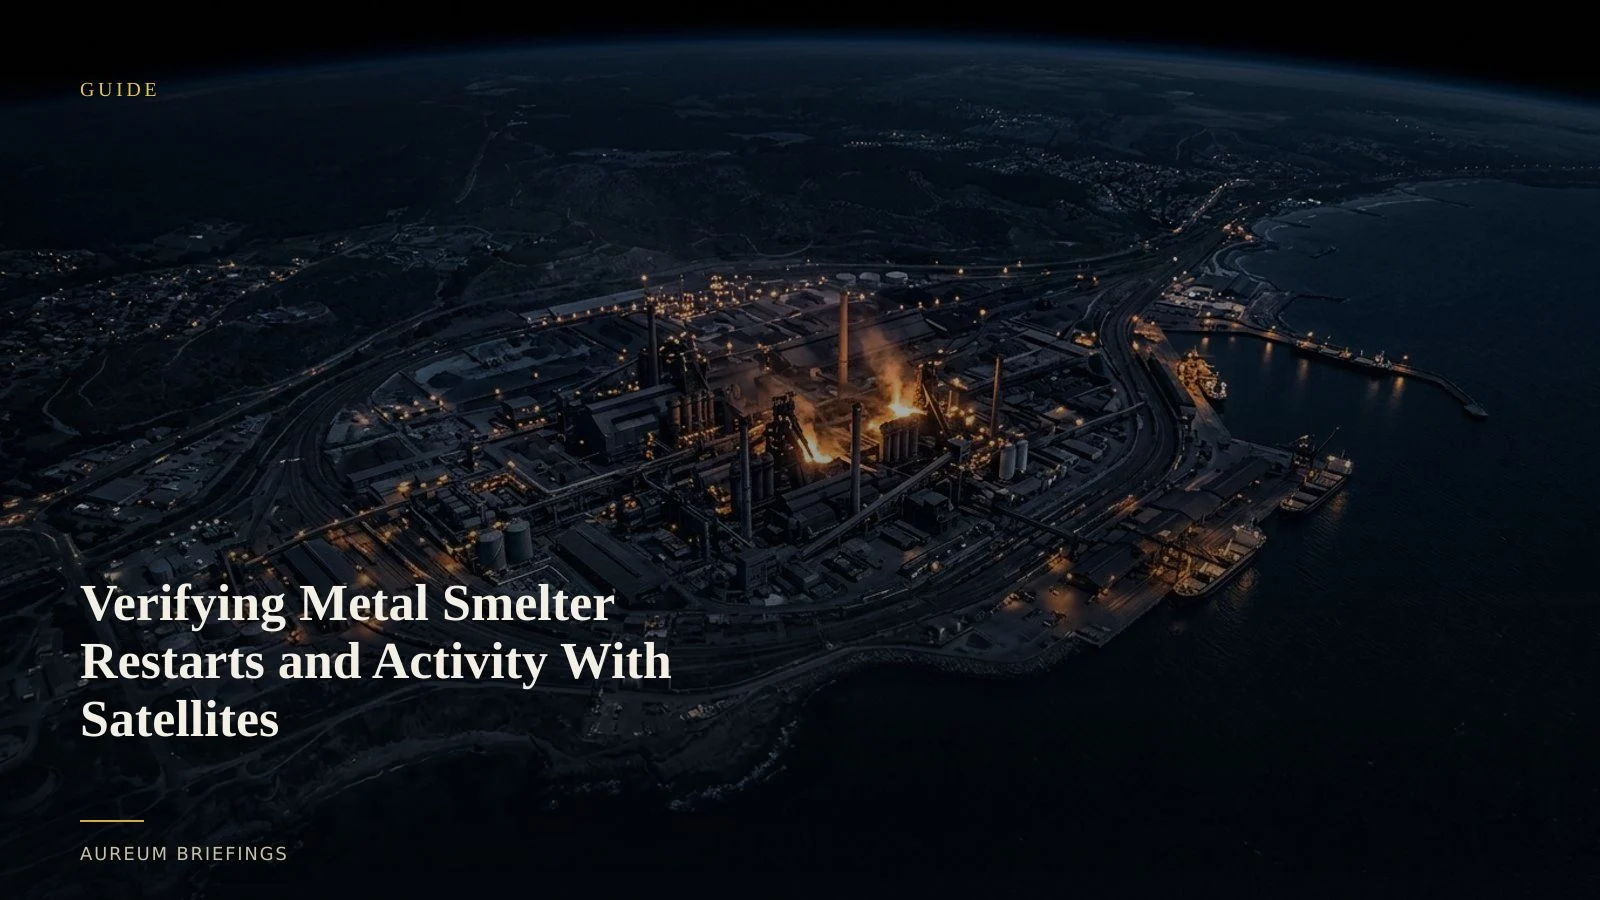
Official metal statistics lag physical restarts
When metal smelters curb capacity or restart dormant furnaces, physical supply balances shift immediately. Market prices, however, often react to market rumours and delayed trade surveys.
Official industry figures, including worldsteel monthly statistics and International Aluminium Institute production metrics, lag ground operations by several weeks. By the time regional output totals publish, early physical signals have already played out.
Trading metals based on physical reality requires direct verification of smelter status. Satellite observation provides a physical line of sight into refining kilns, slag piles, raw material yards, and heat signatures before official statements hit news wires.
Reading physical signatures across optical, radar, and thermal sensors
Smelters and refining complexes are massive industrial assets with unmistakable physical signatures. Optical imagery captures bulk inventory movements, such as raw bauxite yards or scrap piles, confirming whether feedstocks are arriving at the site.
Thermal sensors detect heat anomalies emitted by active furnaces and rotary kilns. A dormant plant shows thermal equilibrium with its surrounding geography, whereas active smelting creates distinct high-temperature signatures.
Synthetic aperture radar (SAR), available through open satellite fleets like the ESA Copernicus satellite program, pierces persistent cloud cover and industrial smoke. Radar reflectivity changes when heavy equipment moves or metal slag builds up on outdoor pads.
Closing the intelligence gap in physical commodity trading
While large institutions pay six-figure subscriptions for institutional satellite indices like SpaceKnow, individual traders and independent investors often rely on lagging news summaries or static imagery baselines.
This asymmetry leaves independent traders exposed when smelter capacity shifts unexpectedly. A facility resuming operation adds physical refined supply long before market narratives reflect the change.
By analysing satellite thermal signatures alongside slag accumulation and raw material intake, market participants can evaluate whether a facility is ramping capacity or heading into maintenance. Benchmarking these physical signals against historical baselines from USGS mineral statistics helps establish realistic operational bounds.
How to evaluate smelter status without a GIS team
Instead of spending days sourcing raw satellite scenes or attempting complex geospatial corrections, traders can focus directly on the operational question: is the plant actively producing metal?
Aureum Track delivers curated hand-built KPI boards covering major refining complexes and commodity corridors. Readers follow established boards to monitor physical changes as satellite passes land.
When an unscheduled shutdown or restart claim surfaces, Query allows you to ask targeted physical questions about specific plants and receive satellite-backed evidence within minutes.
Verify physical metal flows before the market re-prices
Private beta is open. Follow hand-built Track boards on named industrial assets or ask direct satellite questions via Query.