Briefing
Verifying Permian Super-Lateral Well Expansion With Satellites
Permian operators are extending horizontal wellbores past 15,000 feet. Satellite imagery verifies physical pad development and gathering infrastructure weeks before official production prints update.
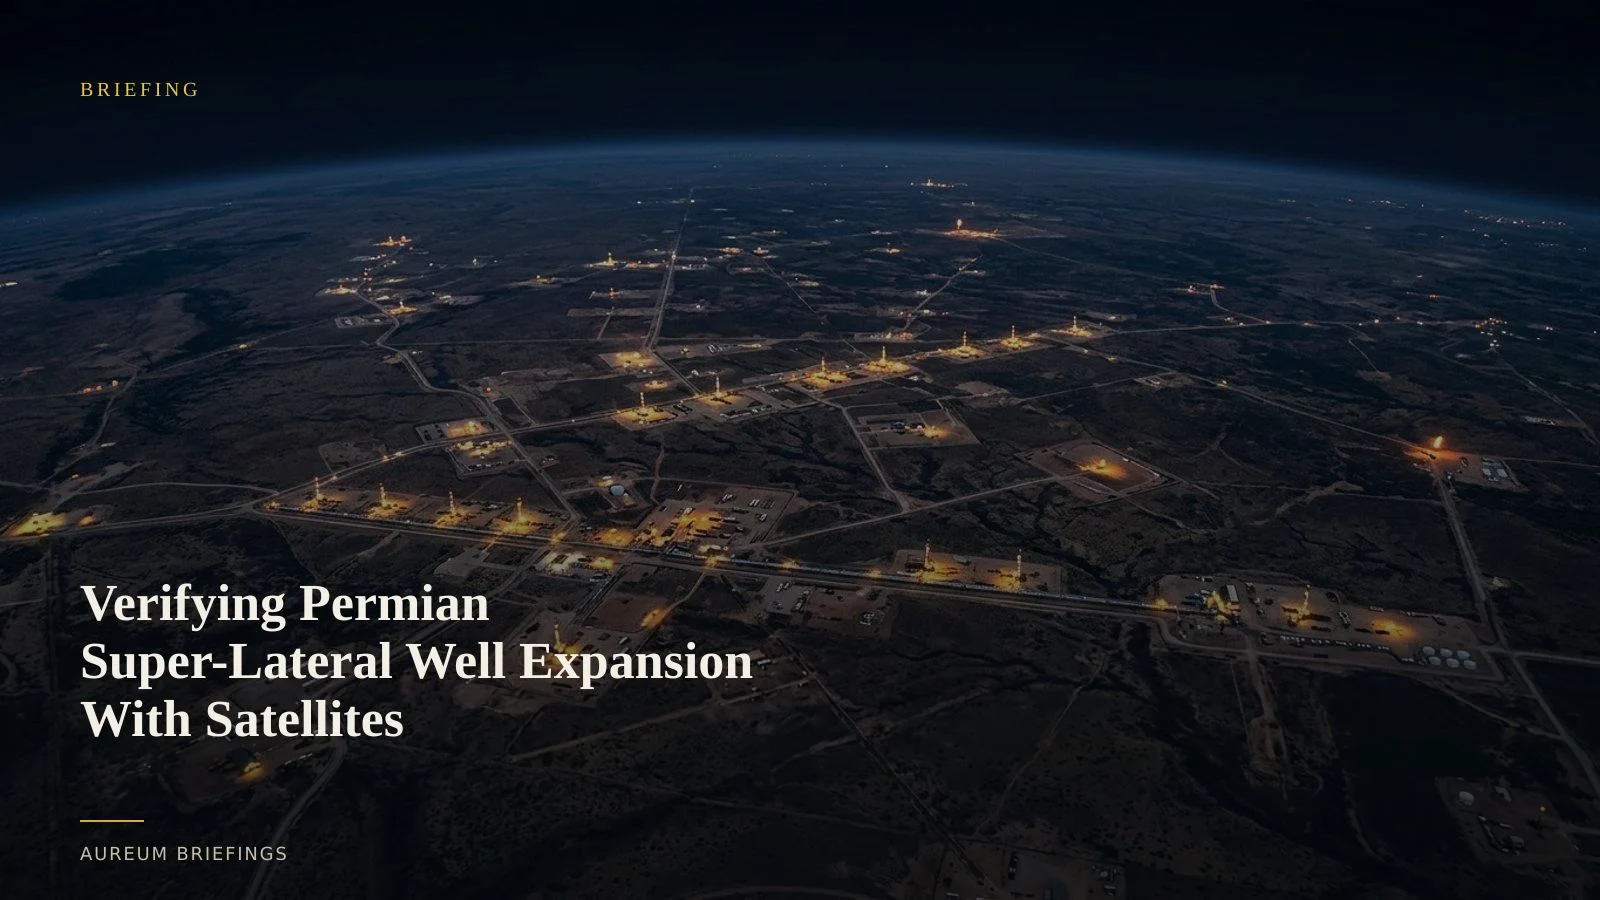
Super-laterals alter the physical footprint of Permian shale
Well operators across the Permian Basin of western Texas and eastern New Mexico are accelerating the transition to super-lateral wells. According to recent EIA Permian drilling data, drilling horizontal wellbores exceeding 15,000 feet allows producers to capture significantly higher crude oil and natural gas volumes per surface pad.
This shift changes the physical surface signature of upstream development. Larger multi-well pads, extended drill pipe staging yards, and expanded water handling facilities create distinct visual footprints long before first oil flows into gathering pipelines.
For commodity traders and energy analysts, waiting for delayed monthly government prints leaves a blind spot during rapid field buildouts.
Verifying pad clearing and ground disturbance with multispectral fusion
Detecting early-stage pad construction and trenching for gathering lines across vast desert acreage requires combining optical resolutions. Peer-reviewed research in Frontiers in Remote Sensing on multi-source sensor fusion demonstrates how combining high-resolution optical imagery with multispectral Sentinel-2 coverage sharpens subtle ground disturbance and linear structural features.
When applied to upstream energy basins, multispectral satellite analysis isolates newly scraped soil, gravel haul roads, and active drill rig locations against background vegetation and rock.
Tracking these physical ground modifications provides an objective, empirical measure of operator completion pacing across Delaware and Midland sub-basins.
Moving past delayed prints and manual mapping
Large institutional funds spend millions to access enterprise satellite stacks and custom GIS teams to map Permian rig movements. DIY investors and independent commodity traders usually fall back to free tools that only provide dated imagery without analysis.
The challenge is not finding raw aerial maps, but converting raw pixels into an accurate timeline of field completions without spending days in specialised software.
By measuring ground disturbance and surface activity across target acreage, traders can assess whether operators are maintaining aggressive drilling schedules before monthly pipeline flow figures publish.
Grounding crude and gas supply expectations
As super-lateral wells increase initial production rates per completion, accurately timing supply growth is critical for pricing local hub differentials, such as Waha gas or Midland crude.
Satellite evidence confirms whether operators are actively turning wells online or holding uncompleted wells in inventory due to regional takeaway bottlenecks.
Integrating physical satellite observations into supply models gives market participants a direct window into the physical velocity of the Permian Basin.
Track the physical economy from space
Private beta is open. Follow hand-built Track boards on named energy sites, or ask Earth a query in plain language.