Commodity Trading & Satellite Intelligence
Verifying Record US Crude Production With Satellites
When government forecasts call for record domestic crude oil output, traders need physical proof across major shale basins before the weekly inventory prints land.
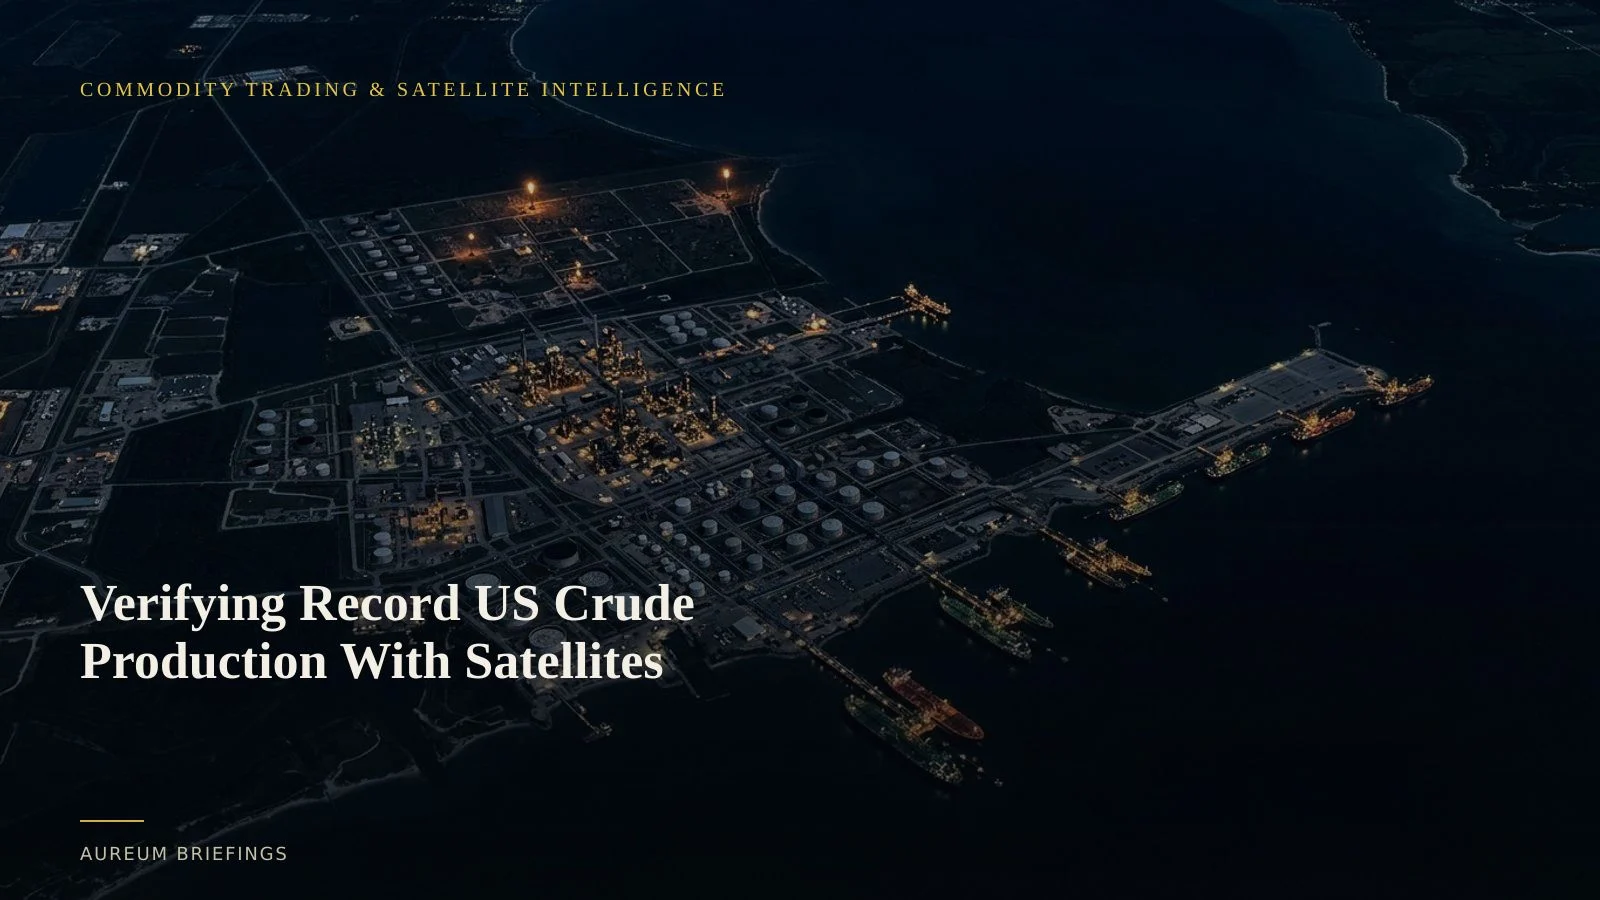
When official projections meet physical wellheads
Government energy agencies regularly update macroeconomic outlooks for energy production. The latest EIA STEO forecast for domestic crude output projects United States crude oil production to average 13.8 million barrels per day in 2026, surpassing previous historic benchmarks.
While macroeconomic models rely on lagged statistical reporting from basin operators, physical markets respond to present supply. A forecast average does not tell a commodity trader whether wellhead completions in the Permian or Eagle Ford are expanding this week or slowing due to regional takeaway bottlenecks.
To decide before official monthly revisions confirm the numbers, market participants turn to satellite-backed analysis that measures physical infrastructure development and flaring volumes directly from orbit.
How satellite embeddings track upstream operations
Evaluating vast oil fields across thousands of square miles presents a spatial challenge. Recent methodological work in remote sensing studies on foundational embeddings highlights how cloud-native geospatial models process multi-spectral observations to detect subtle land-use shifts and industrial infrastructure changes across data-sparse regions.
In the energy sector, satellite-backed verification relies on combining optical pad monitoring with thermal anomaly signatures. By cross-referencing thermal flaring detection from NASA FIRMS, analysts track continuous gas flaring at new wellhead completions. Increased flaring volume across fresh wellpads indicates associated gas co-production from newly brought-online crude wells.
When combined with surface reflectance changes that indicate active drilling rig movements and frac pond drawdowns, these spatial datasets provide direct evidence of active field development long before production volumes appear in government filings.
Bridging headline numbers with basin-level evidence
Relying solely on headline forecasts leaves traders exposed to sudden inventory surprises. A projected record in crude output requires continuous physical alignment across drilling, completion, gatherer compression, and pipeline injection.
If thermal flaring at gathering facilities spikes while downstream storage tank shadows show stable volumes, field constraints or takeaway outages are likely absorbing production. Earlier briefings on verifying US natural gas output highlighted how satellite tracking of pipeline compressor stations clarifies whether upstream flows are hitting regional transport grids.
Measuring these physical components systematically allows traders to verify whether record supply forecasts reflect operational field realities or optimistic statistical extrapolations.
Institutional tools versus accessible Earth intelligence
Historically, institutional commodity desks spent substantial capital maintaining dedicated remote sensing teams or subscribing to institutional satellite analytics platforms to monitor oil storage tank farms and basin flaring.
Individual investors and independent commodity traders were often left using free web tools that offer dated imagery without automated measurement or analytical context. Staring at raw optical tiles without calibrated thermal baseline comparisons fails to answer specific decision questions.
Aureum bridges this gap by delivering targeted satellite intelligence directly through plain-English questions and curated watchlists, bypassing the need for complex GIS infrastructure.
Trading physical energy trends with clarity
Integrating satellite-backed analysis into your trading process shifts your edge from guessing headline reactions to validating physical market fundamentals. When government agencies release revised forecasts, you can evaluate whether field activity supports the print.
Through Query, traders can submit direct questions regarding specific basin developments, wellpad expansions, or terminal staging. For ongoing monitoring, Track offers curated KPI boards following major supply corridors and industrial hubs.
Whether verifying domestic crude expansion or tracking export logistics, access to measured Earth observation provides a firm ground for every decision.
Verify physical energy markets before the print
Private beta is open. Ask Earth a direct question about oil fields or follow curated physical economy KPI boards.