Guide
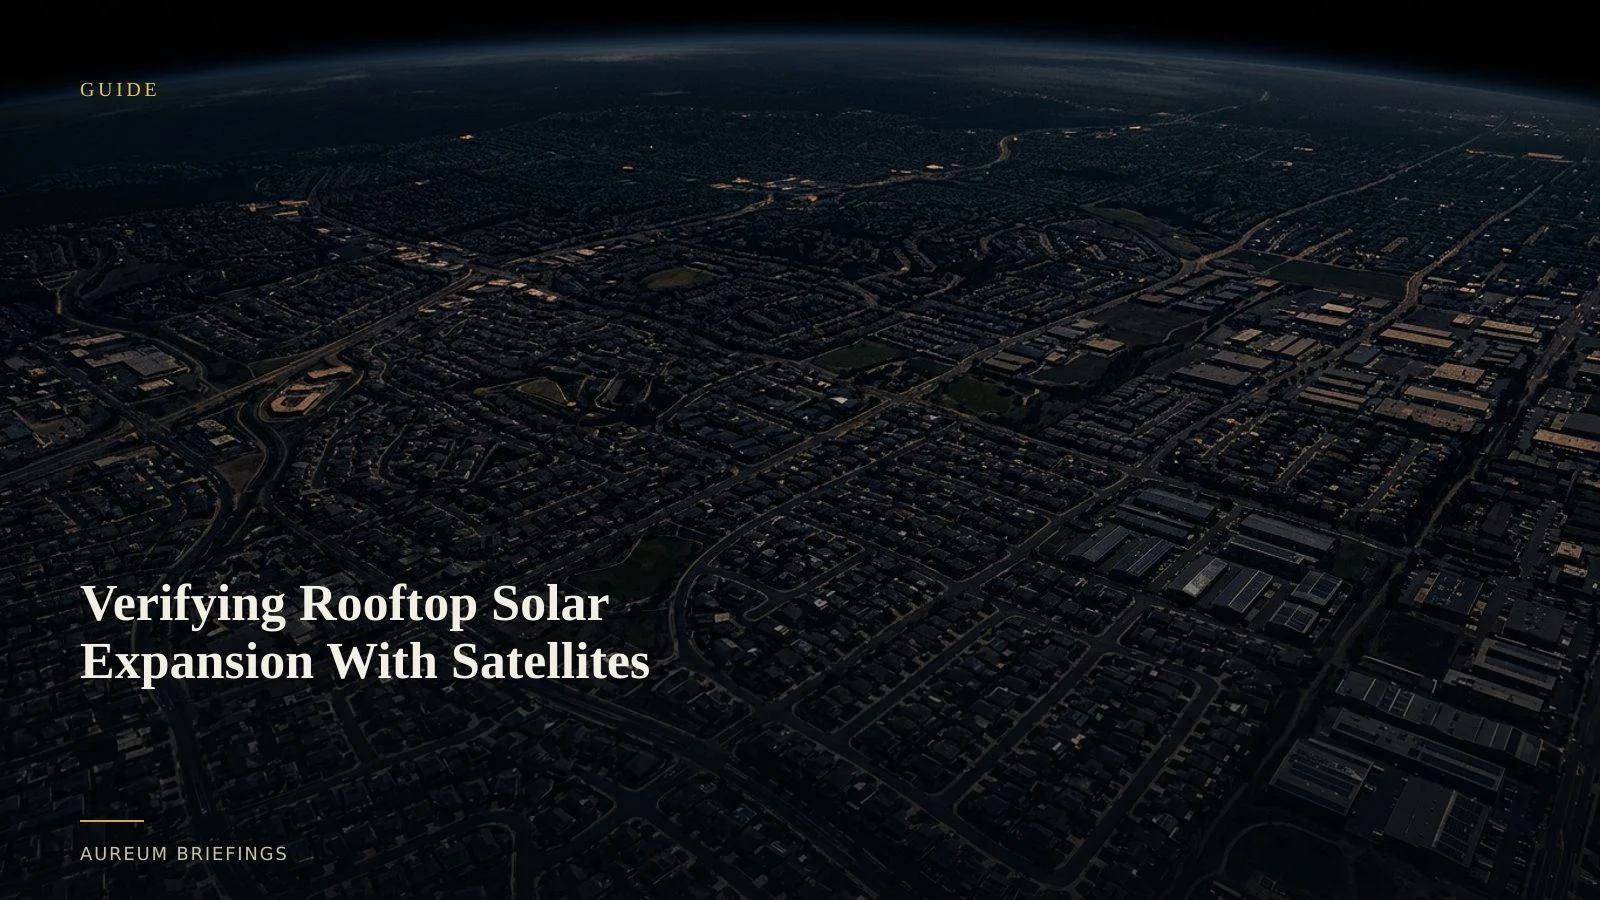
Verifying Rooftop Solar Expansion With Satellites
Small-scale solar generation has quadrupled over the last decade. Here is how traders and energy analysts use satellite data to measure distributed solar capacity before official grid reports print.
Distributed energy moves faster than public prints
Small-scale solar capacity across rooftop installations has surged dramatically over the past decade. Recent EIA small-scale solar generation reports show that generation from residential and commercial rooftop photovoltaics grew from under 19,000 gigawatthours to nearly 93,000 gigawatthours, led by sunny states like California, Texas, Arizona, and Florida alongside high-incentive regions like New York.
While utility-scale solar farms post public interconnection filings, distributed rooftop installations create a subtle physical signature spread across millions of rooftops. Waiting for monthly government updates leaves energy traders and power analysts reacting to stale figures.
Measuring solar module reflections and surface land-cover shifts via USGS Landsat land surface observations provides an empirical ground-truth baseline long before official utility statistics are published.
Detecting roof-level spectral shifts without high-end GIS teams
Detecting distributed solar panels relies on multi-spectral imagery that isolates the unique anti-reflective glass and silicon reflectance of photovoltaic cells against standard roofing materials. High-resolution optical passes combined with short-wave infrared band analysis highlight new solar additions across commercial hubs and industrial parks.
Large hedge funds and commodity trading groups often hire dedicated geospatial engineering units or purchase multi-hundred-thousand-dollar subscriptions to platforms like SpaceKnow industrial analytics to quantify infrastructure expansion. For independent traders and regional energy decision-makers, that level of overhead has historically been out of reach.
By replacing cumbersome spatial processing software with automated spectral queries, individual traders can verify localised installation rates across key distribution corridors in minutes.
Connecting physical roof cover to power grid demand
Distributed solar does not just add total generation capacity; it alters the shape of regional load curves, creating distinct shifts in daily wholesale power pricing. When rooftop capacity expands rapidly across a metro area, peak daytime power draw on local substations drops sharply.
Using satellite-backed evidence from ESA Copernicus Sentinel imagery allows market participants to cross-reference commercial solar panel array footprints against local grid congestion nodes. When combined with regional temperature data, physical roof-coverage metrics offer an early signal for power burn forecasts.
Instead of relying on generalised market commentary or delayed utility releases, tracking physical panel deployment establishes an objective, verified capacity metric.
How Aureum streamlines physical energy intelligence
Query delivers rapid physical analysis for pressing market questions. You can query specific industrial zones, logistical corridors, or agricultural valleys to assess panel installation density without navigating complex satellite data pipelines.
Track enables users to follow curated hand-built boards monitoring critical energy and commodity corridors. Readers track established boards maintained by Aureum as new physical metrics land.
Together, these tools replace expensive enterprise subscriptions and slow manual map searches with simple, direct satellite verification.
Built for independent traders and energy analysts
This workflow is designed for anyone trading power markets, assessing regional utility equities, or tracking clean energy supply chains without an internal research desk.
Whether you are evaluating regional natural gas demand reductions or verifying renewable energy deployment mandates, satellite-backed evidence removes narrative bias from physical market decisions.
When official releases lag behind real-world construction, satellite imagery provides the empirical foundation to act before the consensus catches up.
Start verifying physical energy trends
Free to join during the beta. Ask Earth a question with Query or follow hand-built Track boards.