Briefing
Verifying Steel Mill Output With Satellite Emissions Data
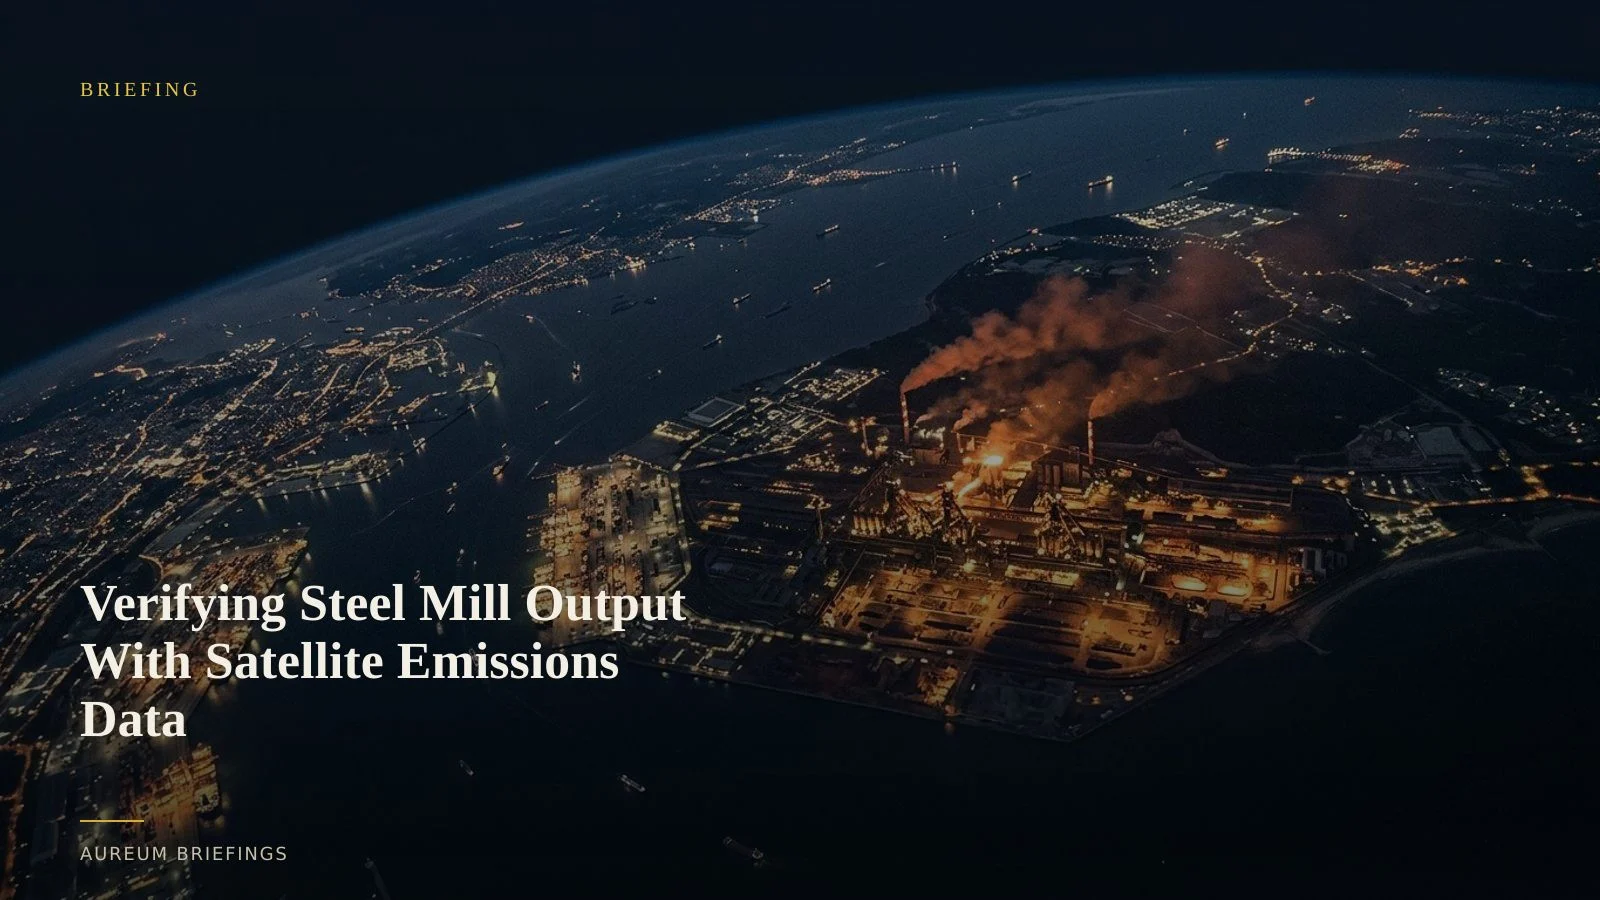
When global crude steel production shifts, official statistics take weeks to publish. Atmospheric satellite sensors show atmospheric plume signals before the market receives the report.
The lag between blast furnace ops and official numbers
Trading industrial metals requires knowing whether production cuts are real or purely narrative. According to worldsteel monthly production reports, global crude steel output contracted to 149.2 million tonnes in July, reflecting a 0.3% year-on-year drop across 70 reporting nations.
For market participants, the problem is timing. By the time national steel associations collect plant figures, consolidate regional data, and publish official volumes, steel futures and iron ore contracts have already moved.
The physical operation changes first. Steel mills throttle blast furnaces, alter sinter plant feed rates, or reduce coke oven temperatures long before corporate releases hit the market.
Reading nitrogen dioxide atmospheric proxies
High-temperature combustion in steel making releases distinct gaseous markers, particularly nitrogen dioxide (NO2) and carbon monoxide (CO). Research on Sentinel-5P atmospheric observations demonstrates how orbital spectrometers like TROPOMI track relative pollutant column density changes over industrial and mining zones.
While atmospheric retrievals require careful handling to account for seasonal wind patterns and satellite retrieval noise, non-ferrous and ferrous smelting clusters produce distinct regional tropospheric footprints.
When an integrated steel plant reduces operating rates, atmospheric column densities of NO2 drop relative to baseline averages. Combining atmospheric gas density trends with optical yard activity provides clear confirmation of facility utilisation.
Fusing gas columns with optical evidence
Atmospheric monitoring alone is an incomplete signal. Heavy cloud cover or regional weather events can skew column density readings over brief windows. Reliable satellite-backed analysis combines atmospheric gas detection with optical and thermal verification.
Optical imagery checks raw material stockyards, verifying whether coal and iron ore discharge piles are shrinking or growing. Meanwhile, thermal imagery evaluates active slag dump heat signatures and kiln operational status.
While large institutions rely on SpaceKnow's enterprise industrial feeds for automated indices, individual traders traditionally lacked direct access to multi-sensor earth observation. Fusing gas data with optical imagery bridges that analytical gap.
How independent investors execute the process
Without an institutional research desk, checking physical economic activity used to mean searching lagging public databases or relying on unverified social commentary.
With Aureum Query, you ask direct questions about facility output, iron ore terminal staging, or regional emissions trends. You receive clear satellite-backed evidence verified against open Earth observation data.
When sustained trend shifts occur, you can follow specific corridors and industrial clusters via hand-built Track KPI boards to monitor ongoing structural changes across global physical commodity markets.
Verify physical economic signals
Private beta is open. Ask Earth a question via Query or follow curated Track boards on global physical hubs.