News
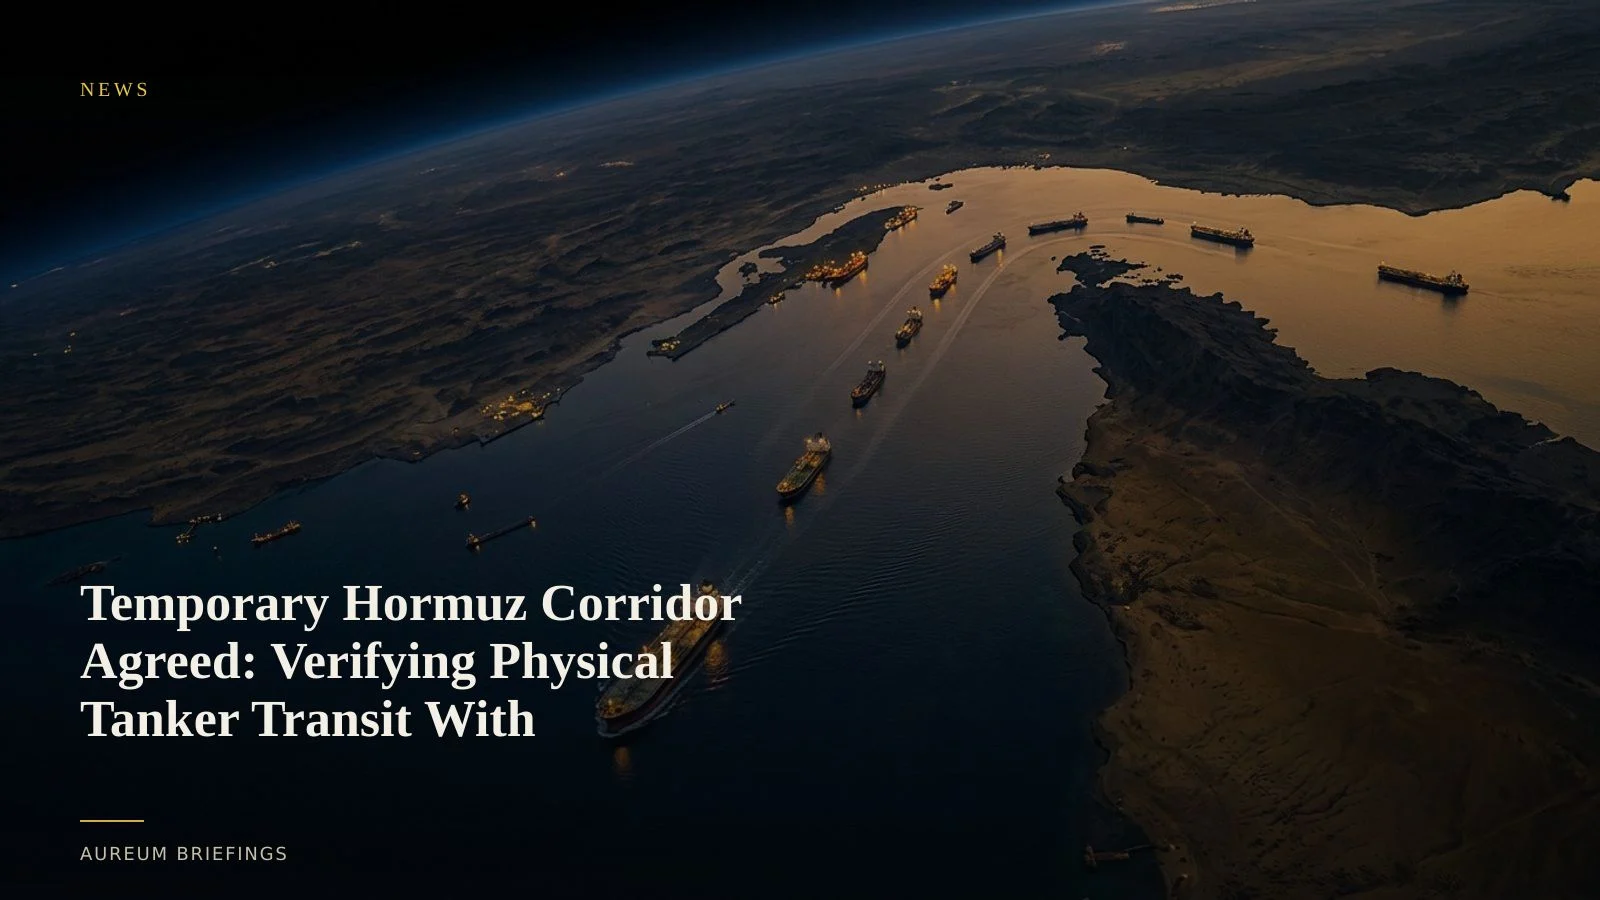
Temporary Hormuz Corridor Agreed: Verifying Physical Tanker Transit With Satellite Radar
As diplomatic talks yield a preliminary agreement on temporary shipping coordinates in the Strait of Hormuz, crude oil prices dropped while gold rallied. Here is how satellite radar verifies whether physical vessel flows match paper market sentiment.
Diplomatic claims press paper crude lower as gold rallies
Paper energy markets tumbled for a second consecutive week following announcements that Washington and Tehran will resume diplomatic negotiations. A preliminary agreement between Iran and Oman established specific geographic coordinates for a temporary shipping channel through the Strait of Hormuz, prompting traders to unwind geopolitical risk premiums in crude while allocating capital into gold.
While paper futures dropped on headline news, physical commodity traders face a distinct question: are commercial oil tankers actually navigating the designated coordinates, or are vessels remaining at anchor in floating storage?
Verifying corridor coordinates with synthetic aperture radar
Relying on automatic identification system (AIS) transmissions alone leaves blind spots, as dark vessels and spoofed signals frequently mask real positions in contested transit zones. Large institutions can afford commercial synthetic aperture radar vessel tracking; DIY readers usually cannot, so they lean on open Sentinel-1 passes that still pierce cloud and night to detect larger hulls without a transponder.
Overlaying high-frequency radar observations onto the agreed Oman-Iran transit coordinates provides direct physical confirmation. Comparing active vessel signatures inside the narrow fairway against historical anchorages reveals whether commercial operators are actively transiting the corridor or awaiting further security guarantees.
Reconciling paper market headlines with physical inventories
Diplomatic announcements often trigger immediate price swings across energy and precious metals futures, yet physical crude logistics adapt at a different pace. When crude prices retreat, macro capital frequently shifts into gold bullion, assuming supply disruptions have subsided.
However, if satellite imagery shows crude accumulating in regional floating storage or lingering near terminal berths, paper price drops can quickly reverse. Combining vessel flow monitoring with public AIS tracking views allows traders to measure true physical throughput before official supply statistics print.
Moving from headline sentiment to physical evidence
Institutional commodity traders have long monitored satellite feeds to evaluate physical supply shifts. DIY traders and independent market participants can now access the exact same earth observation capabilities to verify whether ground realities match geopolitical news.
Whether analysing crude tanker density along newly opened shipping lanes or tracking inventory draws across global storage terminals, satellite intelligence grounds trading decisions in objective physical facts rather than speculative headlines.
How Aureum supports physical market observation
Query provides on-demand satellite-backed answers when news breaks, allowing you to ask specific spatial questions about port congestion, corridor transits, or industrial facilities.
Track delivers continuous monitoring across critical global watchlists, keeping you informed as physical assets move and supply chains react across the global economy.
Verify the physical economy before the market prices it
Join the Aureum beta to monitor transit corridors, terminal inventories, and supply chains with satellite-backed evidence.