Briefing
Verifying US LNG Export Capacity Surges With Satellites
US liquefaction terminals moved record volumes in the first half of 2026. Here is how satellite-backed analysis tracks physical terminal throughput before official figures release.
Capacity growth meets lagging print releases
US liquefied natural gas exports averaged 17.4 billion cubic feet per day in the first six months of 2026, marking a 23 per cent surge over the previous year according to EIA US LNG export data. Additional liquefaction capacity along the Gulf Coast drove these record flows, with output expected to average 17.3 Bcf/d in the second half before expanding further in 2027.
For natural gas and global LNG traders, monthly macroeconomic releases confirm where energy moved weeks after physical transactions took place. Knowing terminal utilisation during active market swings requires observing physical infrastructure directly.
When price spreads between US Henry Hub, European TTF, and Asian JKM widen, waiting for lagged reporting leaves traders exposed to unexpected operational pauses or rapid export spikes.
Spatial detection for coastal liquefaction facilities
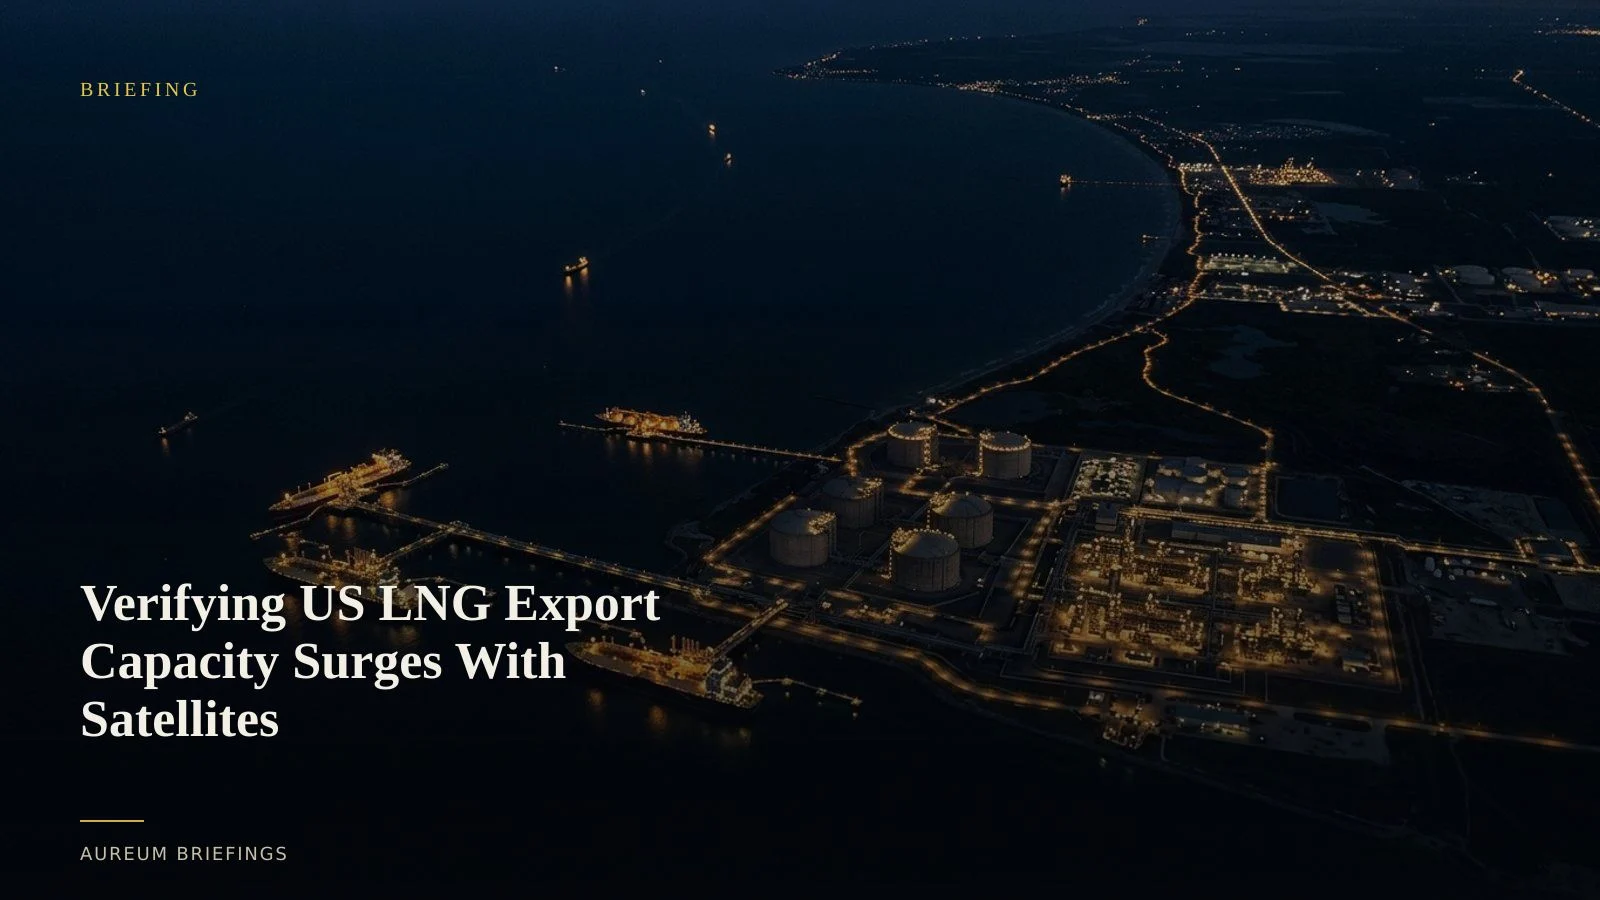
Monitoring massive coastal terminals involves identifying complex infrastructure including cryogenic storage tanks, flaring stacks, and berthed LNG carriers. Advanced computer vision techniques, such as high-resolution coastal satellite detection methods, deploy oriented bounding boxes to isolate rotated marine vessels and elongated docks without background noise.
By processing optical and synthetic aperture radar coverage, automated spatial models count moored tankers and evaluate berth turnover rates across major export hubs like Sabine Pass, Freeport, and Calcasieu Pass.
Combining vessel positioning with thermal signatures from ground liquefaction units shows whether a terminal is running at maximum nameplate capacity or undergoing unannounced maintenance.
Moving beyond enterprise fund tools
Institutional commodity trading desks often spend hundreds of thousands of pounds on enterprise analytics platforms like Ursa Space oil and gas tracking or custom remote sensing feeds to monitor global energy flows. These specialised enterprise systems require dedicated data science teams to maintain complex spatial pipelines.
Independent traders and individual investors traditionally lacked access to these institutional workflows, having to rely on outdated public imagery platforms or unverified market commentary.
Aureum bridges this intelligence gap by providing direct satellite-backed analysis, turning complex Earth observation data into clear operational answers without high overheads.
Building a satellite-backed trading workflow
Trading based on satellite images does not require manual image comparison or GIS expertise. Effective physical economy analysis relies on structured answers grounded in recent satellite passes.
Using Query, traders can ask targeted questions about terminal activity, flare intensity, or vessel staging prior to major market announcements. When ongoing surveillance is required, following established energy watchlists on Track delivers consistent physical updates.
By incorporating objective physical evidence into risk models, market participants trade with clear visibility into real supply dynamics rather than delayed assumptions.
Verify natural gas flows before the report
Get satellite-backed answers on global energy infrastructure in minutes with Aureum Query.