News
Saudi Yanbu Crude Terminal Risk: Satellite Verification
Houthi strikes on Saudi crude tankers off Yanbu threaten the primary Red Sea bypass for Gulf energy. Here is how satellite analysis verifies Yanbu terminal activity and tank storage.
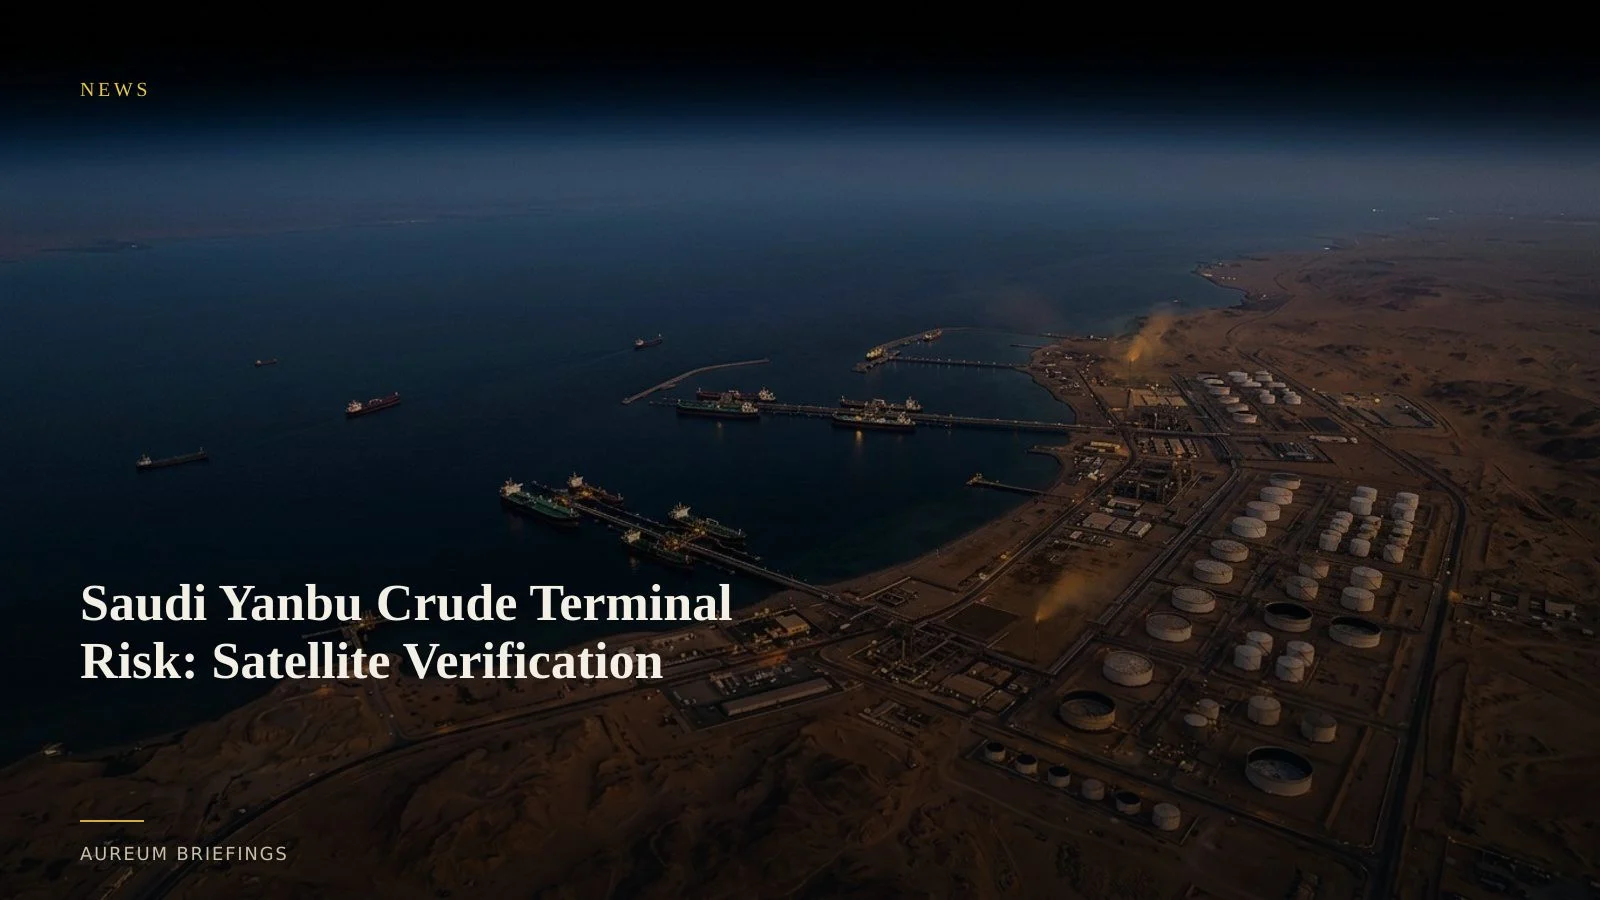
Red Sea strikes move north to Yanbu bypass infrastructure
Saudi Arabia confirmed that the crude tanker Amzan was targeted by ballistic missiles and drones off the western port of Yanbu. Reports on Saudi crude shipping disruptions off Yanbu mark a geographic shift in Red Sea security risks, moving threat vectors directly adjacent to Saudi Arabia's primary western export terminal.
Yanbu serves as the western terminus for the 5 million barrel-per-day East-West Pipeline (Petroline), designed specifically to bypass the Strait of Hormuz. When maritime disruption escalates around southern chokepoints, market participants assume crude volume shifts seamlessly to Red Sea berths.
Official export statistics lag physical loading operations by weeks. Relying on delayed shipping statements leaves individual traders exposed when loading queues at Yanbu stall or divert.
Compound risks for global commodity logistics
The attack on Yanbu crude traffic occurs alongside broader physical supply chain strain across energy and agricultural corridors. Research on macro food crisis scenarios highlights how maritime chokepoints and climate shocks compound fertiliser and bulk freight vulnerabilities.
If tankers avoid the northern Red Sea, crude flows must either pay elevated war-risk premiums or take the multi-week detour around Africa. These disruptions strain downstream inventory buffers at destination ports across Europe and Asia.
Large institutional entities monitor these physical bottlenecks using expensive enterprise platforms. Individual investors who rely only on free web maps usually encounter outdated imagery that lacks systemic quantitative analysis.
What satellite imagery reveals at Yanbu
Measuring physical operations at Yanbu requires specific Earth observation techniques. Optical sensors like European Sentinel satellite imagery capture floating-roof tank shadows, allowing analysts to calculate changes in crude storage volumes across the terminal tank farm.
To track vessel movements through smoke or nighttime conditions, commercial synthetic aperture radar provides specialised imagery used by large institutions, though individual traders can access similar structural insight through focused analytical platforms.
Berth occupancy and tanker staging show immediate physical operational status. When a vessel is hit or delayed, satellite imagery confirms whether crude loading continues or anchored queues accumulate along the coast.
How to evaluate Yanbu disruption before official prints
When news breaks of an attack off Yanbu, the immediate trade question is whether physical loading has halted or crude is being diverted back through alternative pipelines.
Query provides satellite-backed evidence on facility activity without requiring a specialised remote sensing team or complex GIS software.
By pairing Query for specific event validation with hand-built Track boards across key corridors, traders can evaluate physical supply reality when official trade prints remain unconfirmed.
Verify physical energy logistics with Aureum
Private beta is open. Ask Earth a question with Query, or follow hand-built Track boards on strategic energy and freight corridors.