News
Asian LNG Spikes Past $30 on Red Sea Strike: Verifying Pacific Energy Flows With Satellites
Middle East maritime security risks have pushed Asian natural gas spot prices to multi-year highs. Satellite imagery confirms how East Asian energy buyers are shifting focus to Pacific supply alternatives.
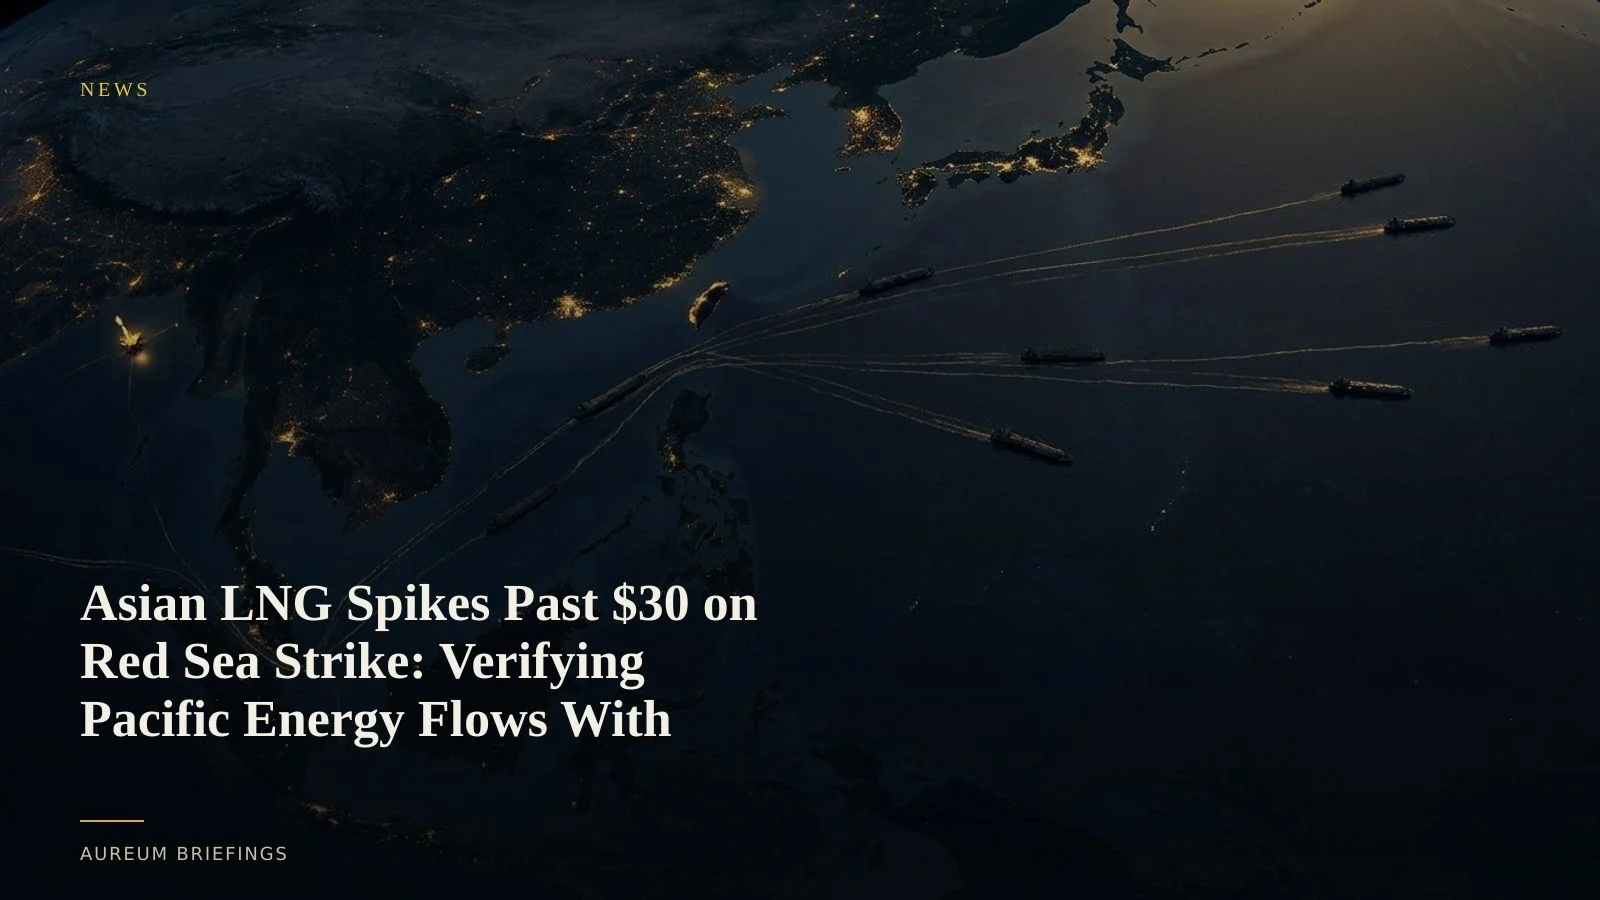
Red Sea vessel attack drives Asian spot LNG to $30
Spot natural gas prices in East Asia surged past $30 per million British thermal units following security incidents off the Yemeni coast. Maritime security reports confirmed an LNG carrier came under small-boat gunfire in the Gulf of Aden, prompting retaliatory warning shots from the vessel crew.
The security disruption triggered an immediate repricing across Asian energy desks. Recent Asian spot LNG price spikes reflect growing fear that Middle East transit chokepoints could suffer prolonged operational halts or prohibitive insurance surcharges.
For commodity traders, the immediate focus shifts from regional panic to physical supply substitution. Importers in Japan, South Korea, and Taiwan are forced to re-evaluate their reliance on Persian Gulf transits and pull additional volumes from Pacific basin export facilities.
Pacific bypass corridors gain strategic weight
As Middle East transit routes grow volatile, North American West Coast infrastructure is becoming a critical counterweight. Expanded pipeline capacity along the Canadian Pacific coast and US West Coast export terminals offer direct maritime routes to East Asia that completely bypass Western Indian Ocean chokepoints.
Institutional analysis from the Atlantic Council research on Pacific energy transit underscores how Pacific crude and gas export capacity serves as a structural buffer during Middle East supply crises. Securing reliable energy flows across the Pacific reduces exposure to Red Sea and Bab el-Mandeb friction.
The key question for market participants is whether Pacific terminals can scale throughput quickly enough. Verifying vessel staging, berth activity, and storage tank utilisation at West Coast export sites reveals whether physical supply is expanding to meet Asian demand.
Measuring terminal loading and anchorage staging
Traditional trade reporting lags physical movement by weeks. Customs prints and official port throughput numbers leave traders guessing about immediate operational shifts.
Satellite-backed analysis bridges this gap. By observing optical reflectance and synthetic aperture radar returns across West Coast terminals, traders can verify carrier staging, berth residency times, and tank farm volume changes.
While institutional trading desks often contract ICEYE commercial SAR data to track fleet staging in all weather conditions, individual investors require a streamlined platform to answer physical market questions without enterprise software budgets.
How DIY investors trade physical energy shifts
When headline geopolitical risk spikes price spreads, relying on headline sentiment alone exposes traders to sudden reversals. Verifying physical asset operations provides a grounded signal.
Traders tracking North American LNG and crude export capacity can combine verifying US LNG export capacity with direct satellite observation of West Coast marine facilities.
With Query, you can ask plain-English questions about specific terminal locations and receive clear satellite evidence. For ongoing monitoring, Track allows you to follow hand-built KPI boards across key commodity corridors, ensuring you see physical disruptions as coverage lands.
Run the satellite verification workflow
Free to join during the beta. Ask Earth a question with Query, or follow curated KPI boards across global commodity corridors with Track.