Tracker
Strait of Hormuz traffic: the latest satellite pass
No vessels are visible in the cloud-free part of the strait's traditional shipping lanes in the Sentinel-2 picture of 3 November 2026. A year earlier, the same window held at least 16. Here are the pictures, what they can and cannot show, and why the ship counts in the news disagree.
Is the Strait of Hormuz open?
Some ships are passing, by both Iranian and US accounts, but far fewer than before the war, and no source has described the whole strait since 1 November 2026. What can be said, with dates:
3 November 2026, Sentinel-2 pass: no vessels visible in the cloud-free part of the traditional lanes east of the Quoin islands (pictures below).
7 November 2026: the IRGC Navy said 26 vessels had passed in the previous 24 hours "under the coordination and security of the IRGC Navy" (Ilke News Agency).
31 October 2026: US Central Command said its forces had redirected 144 commercial vessels under its naval blockade of Iranian ports (Middle East Eye).
30 October 2026: Admiral Brad Cooper, CENTCOM's commander, said that flying over the strait he "saw dozens of commercial vessels transiting", while more than 10,000 US forces enforced the blockade of Iranian ports and oil terminals (VOA).
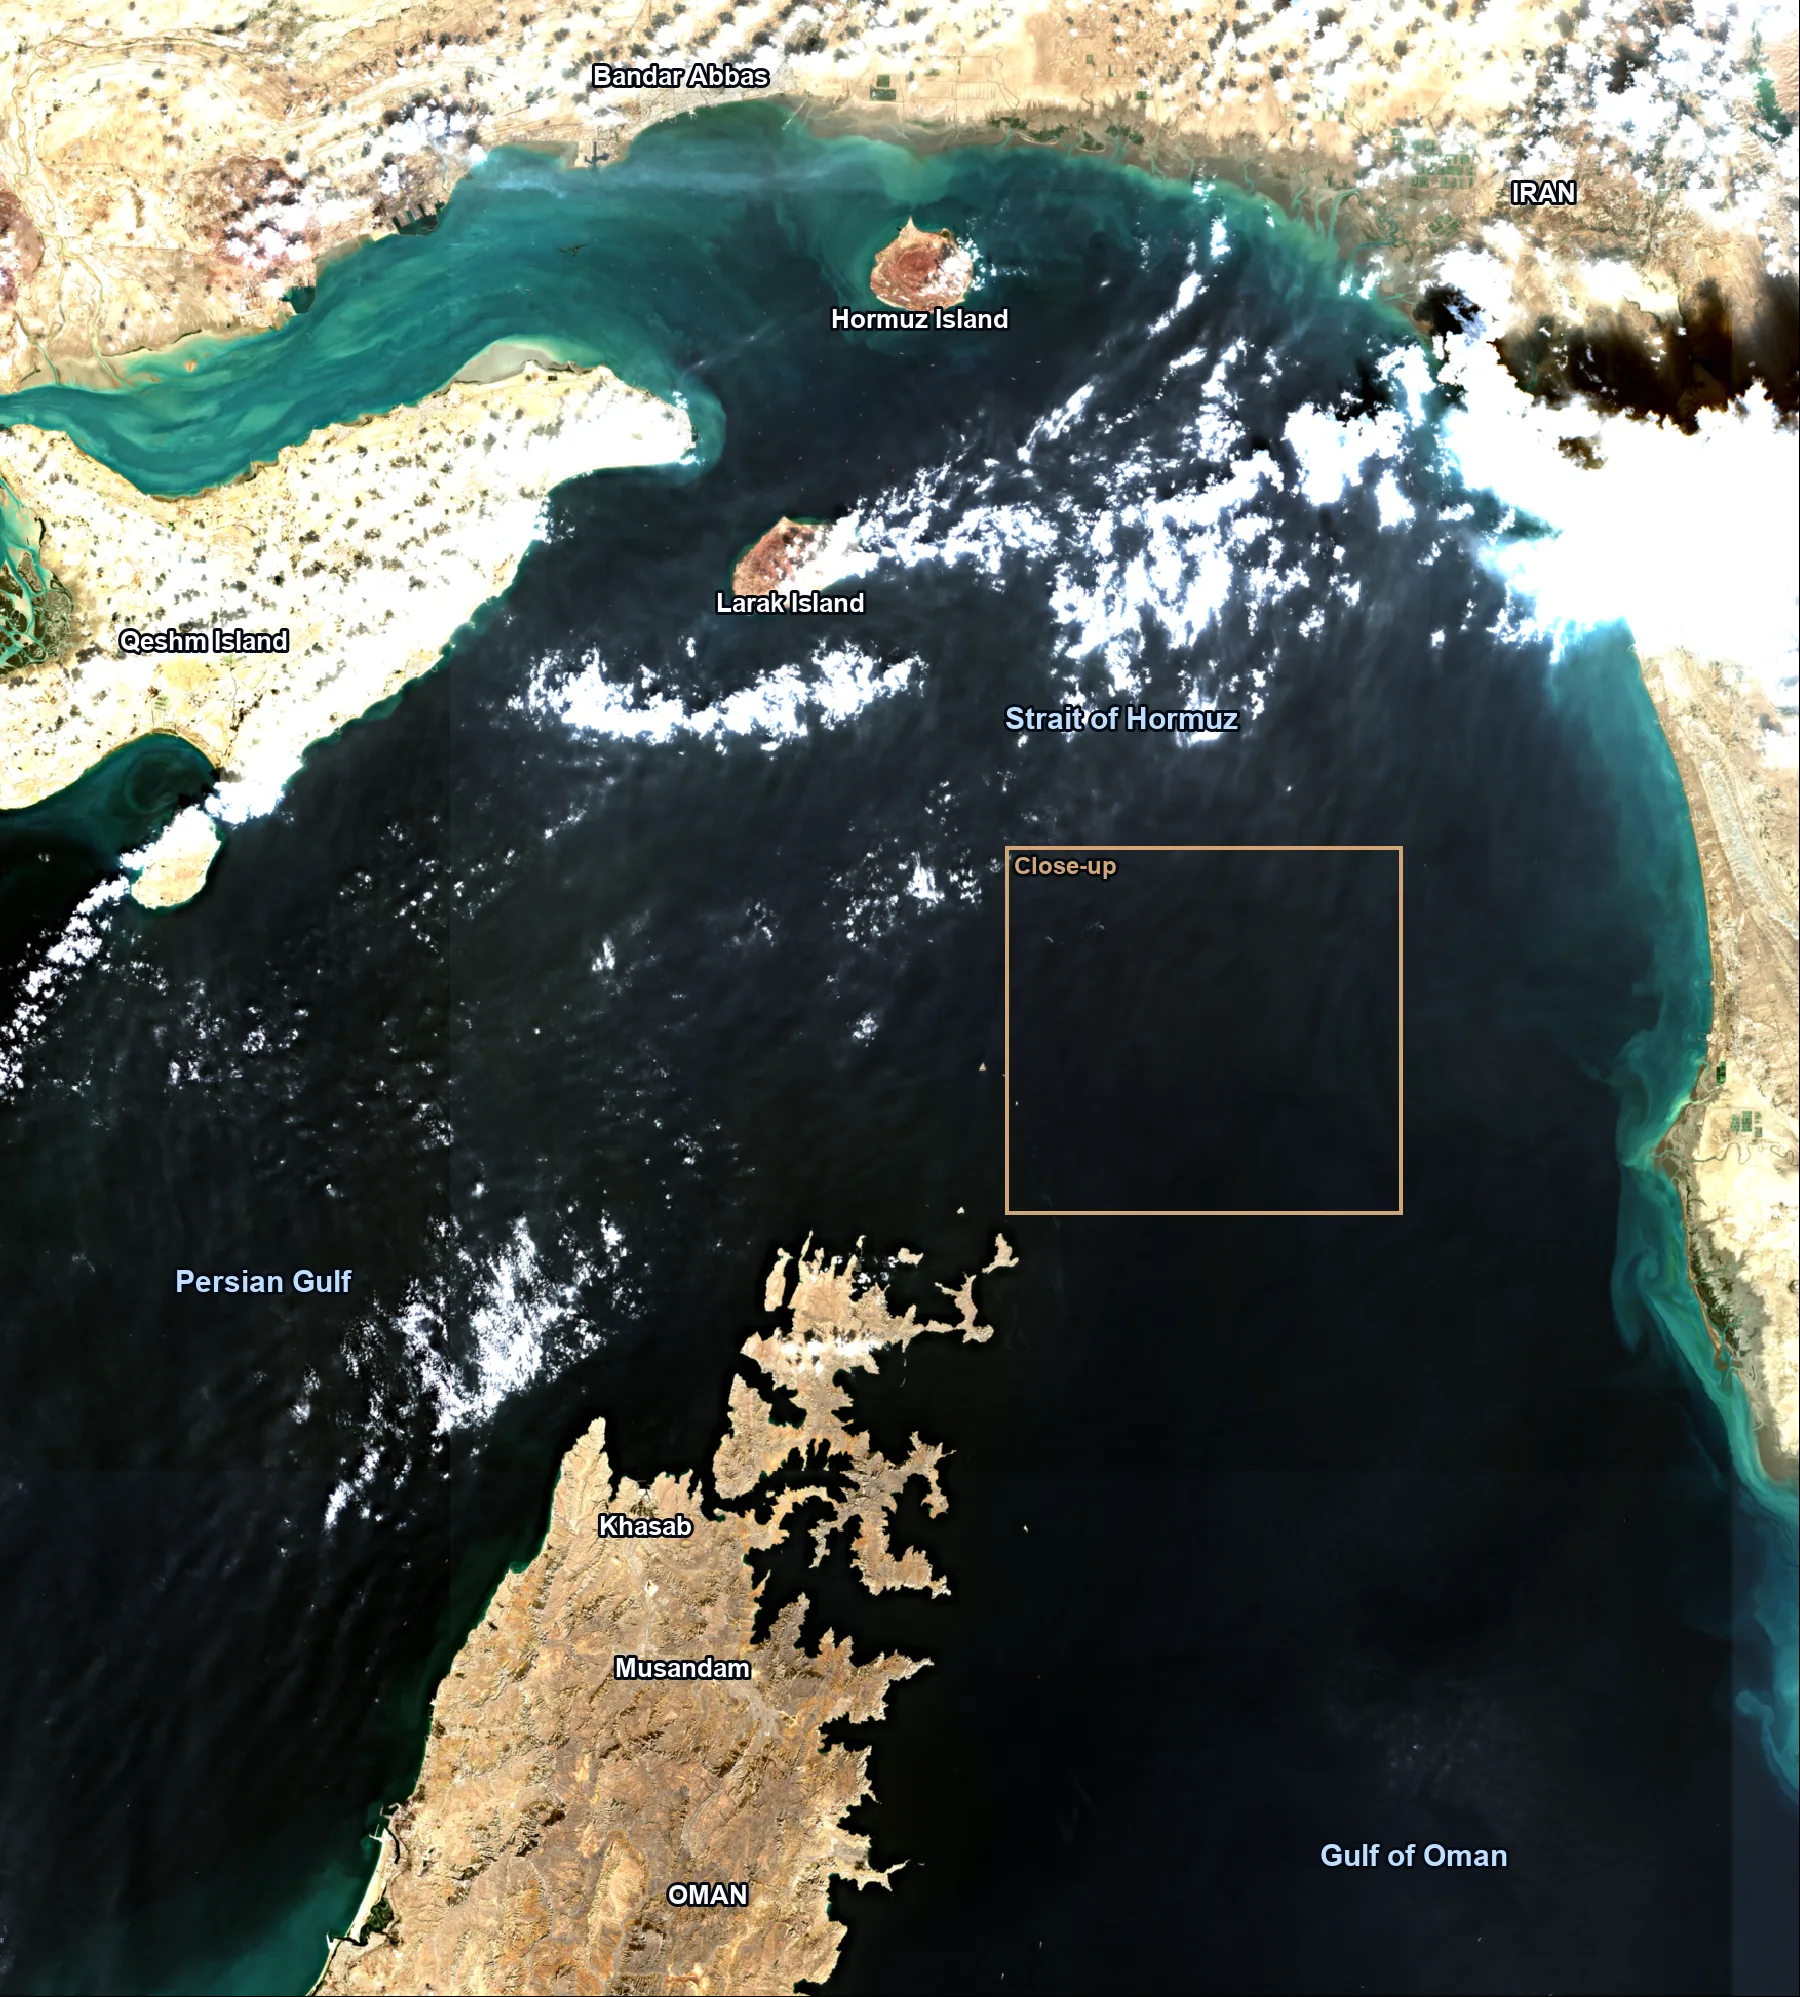
Map of the Strait of Hormuz from the latest pass
The strait joins the Persian Gulf to the Gulf of Oman, between Iran and the Musandam peninsula of Oman. At its narrowest it is 21 miles wide, and the shipping lane in each direction is two miles wide, with a two-mile buffer between them (EIA).
This picture comes from the Sentinel-2C pass at 07:01 UTC on 3 November 2026. Cloud covers parts of the north of the strait. The gold box marks the close-up further down.
The same lanes, one year apart
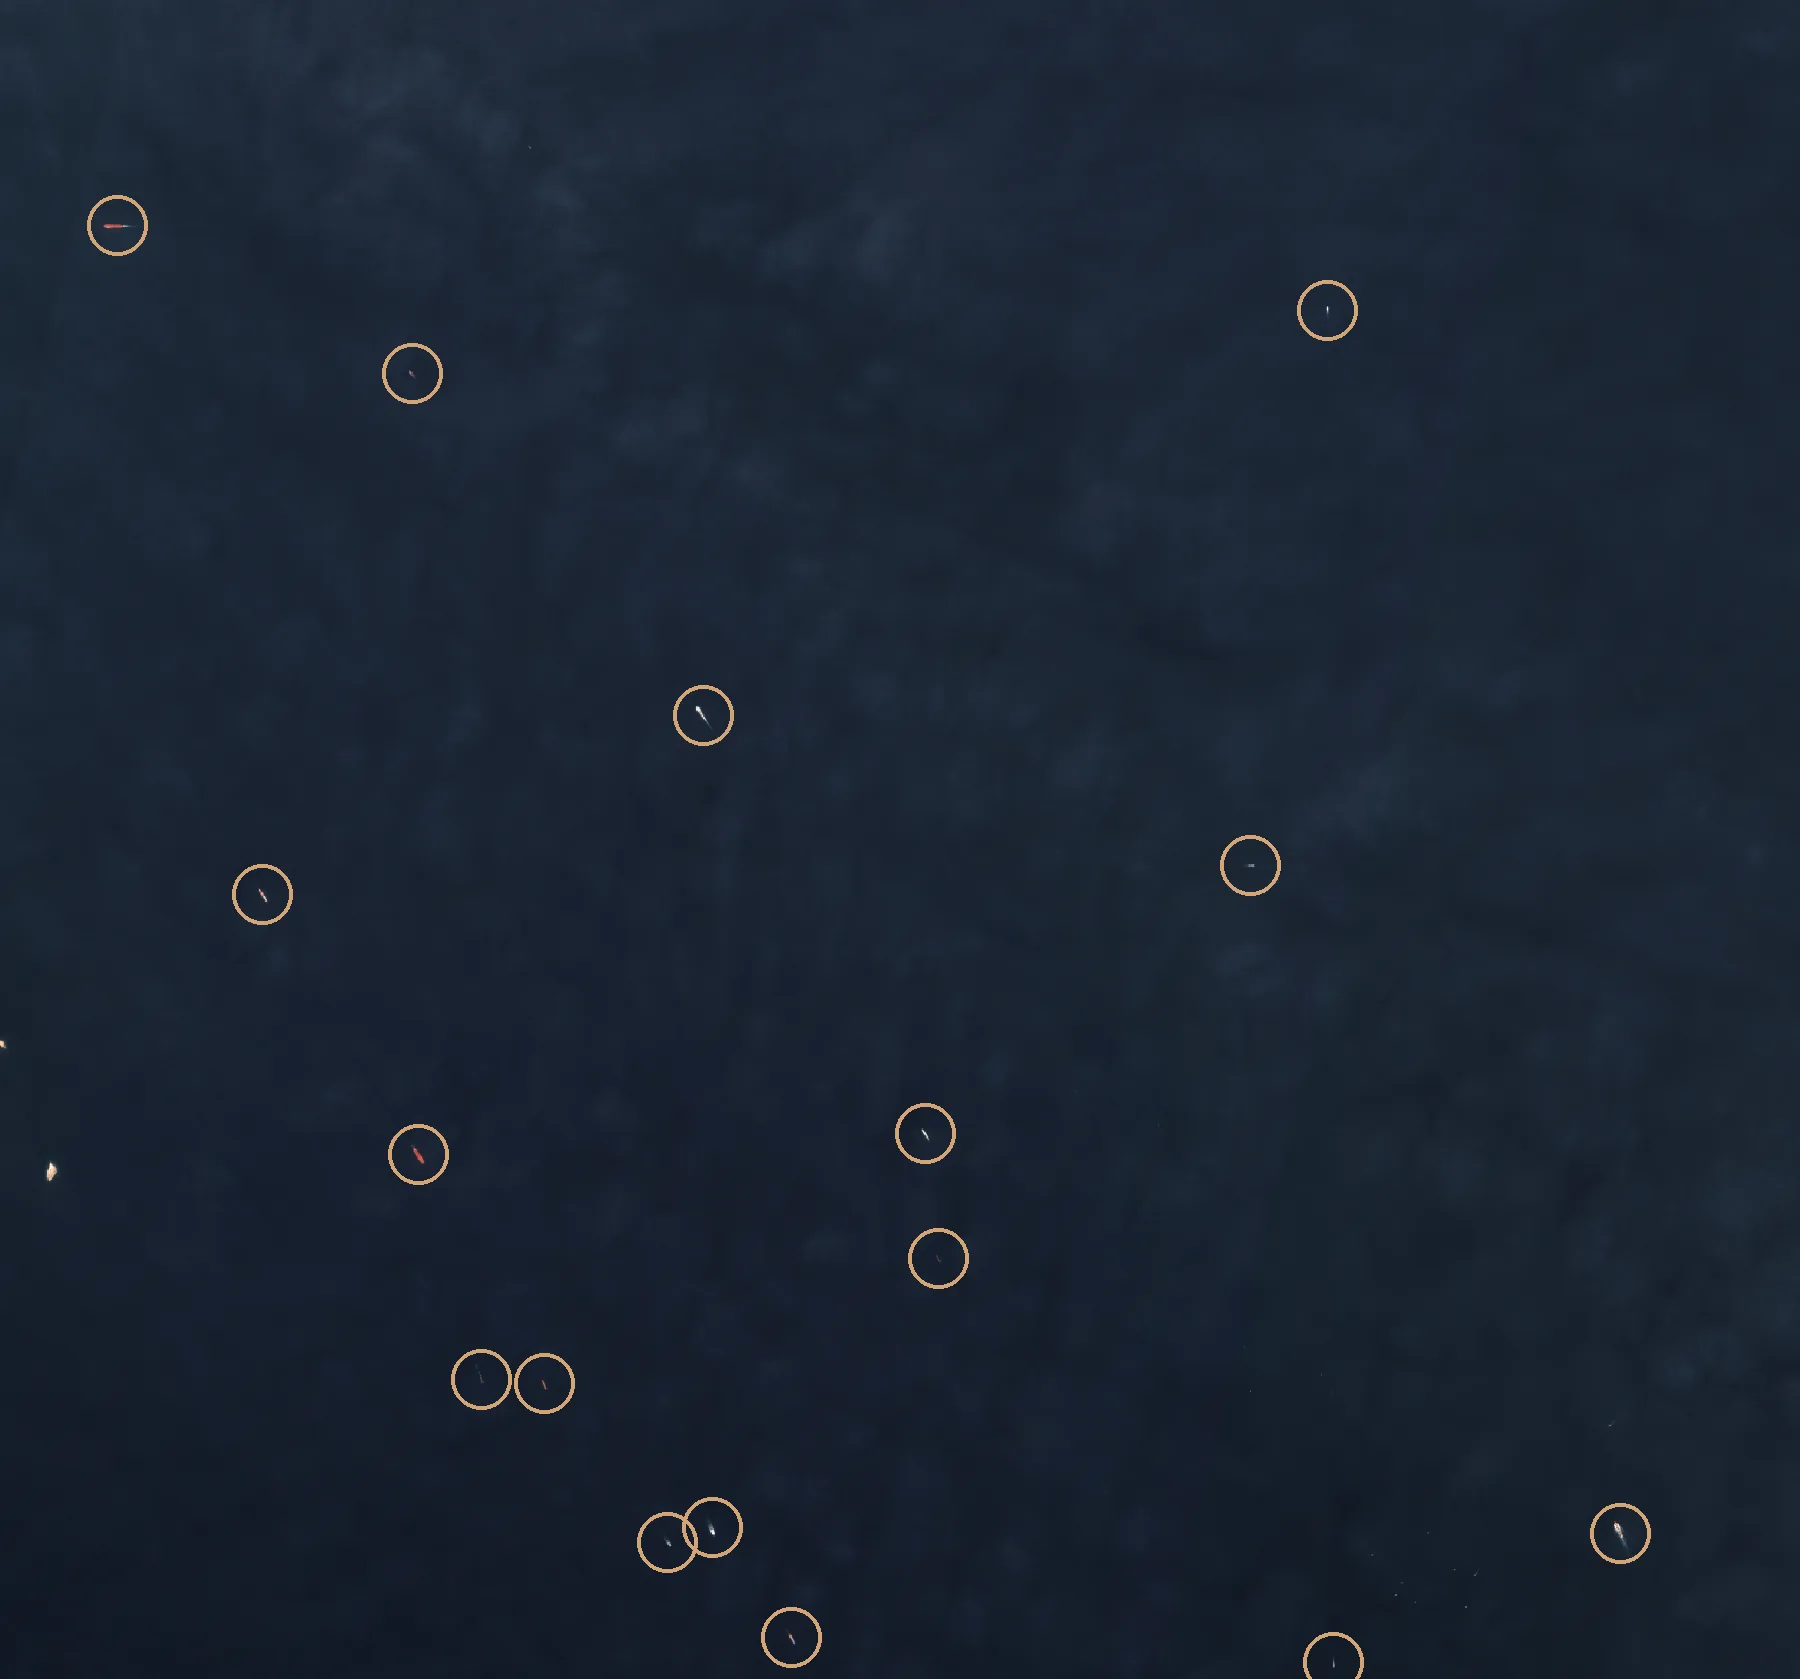
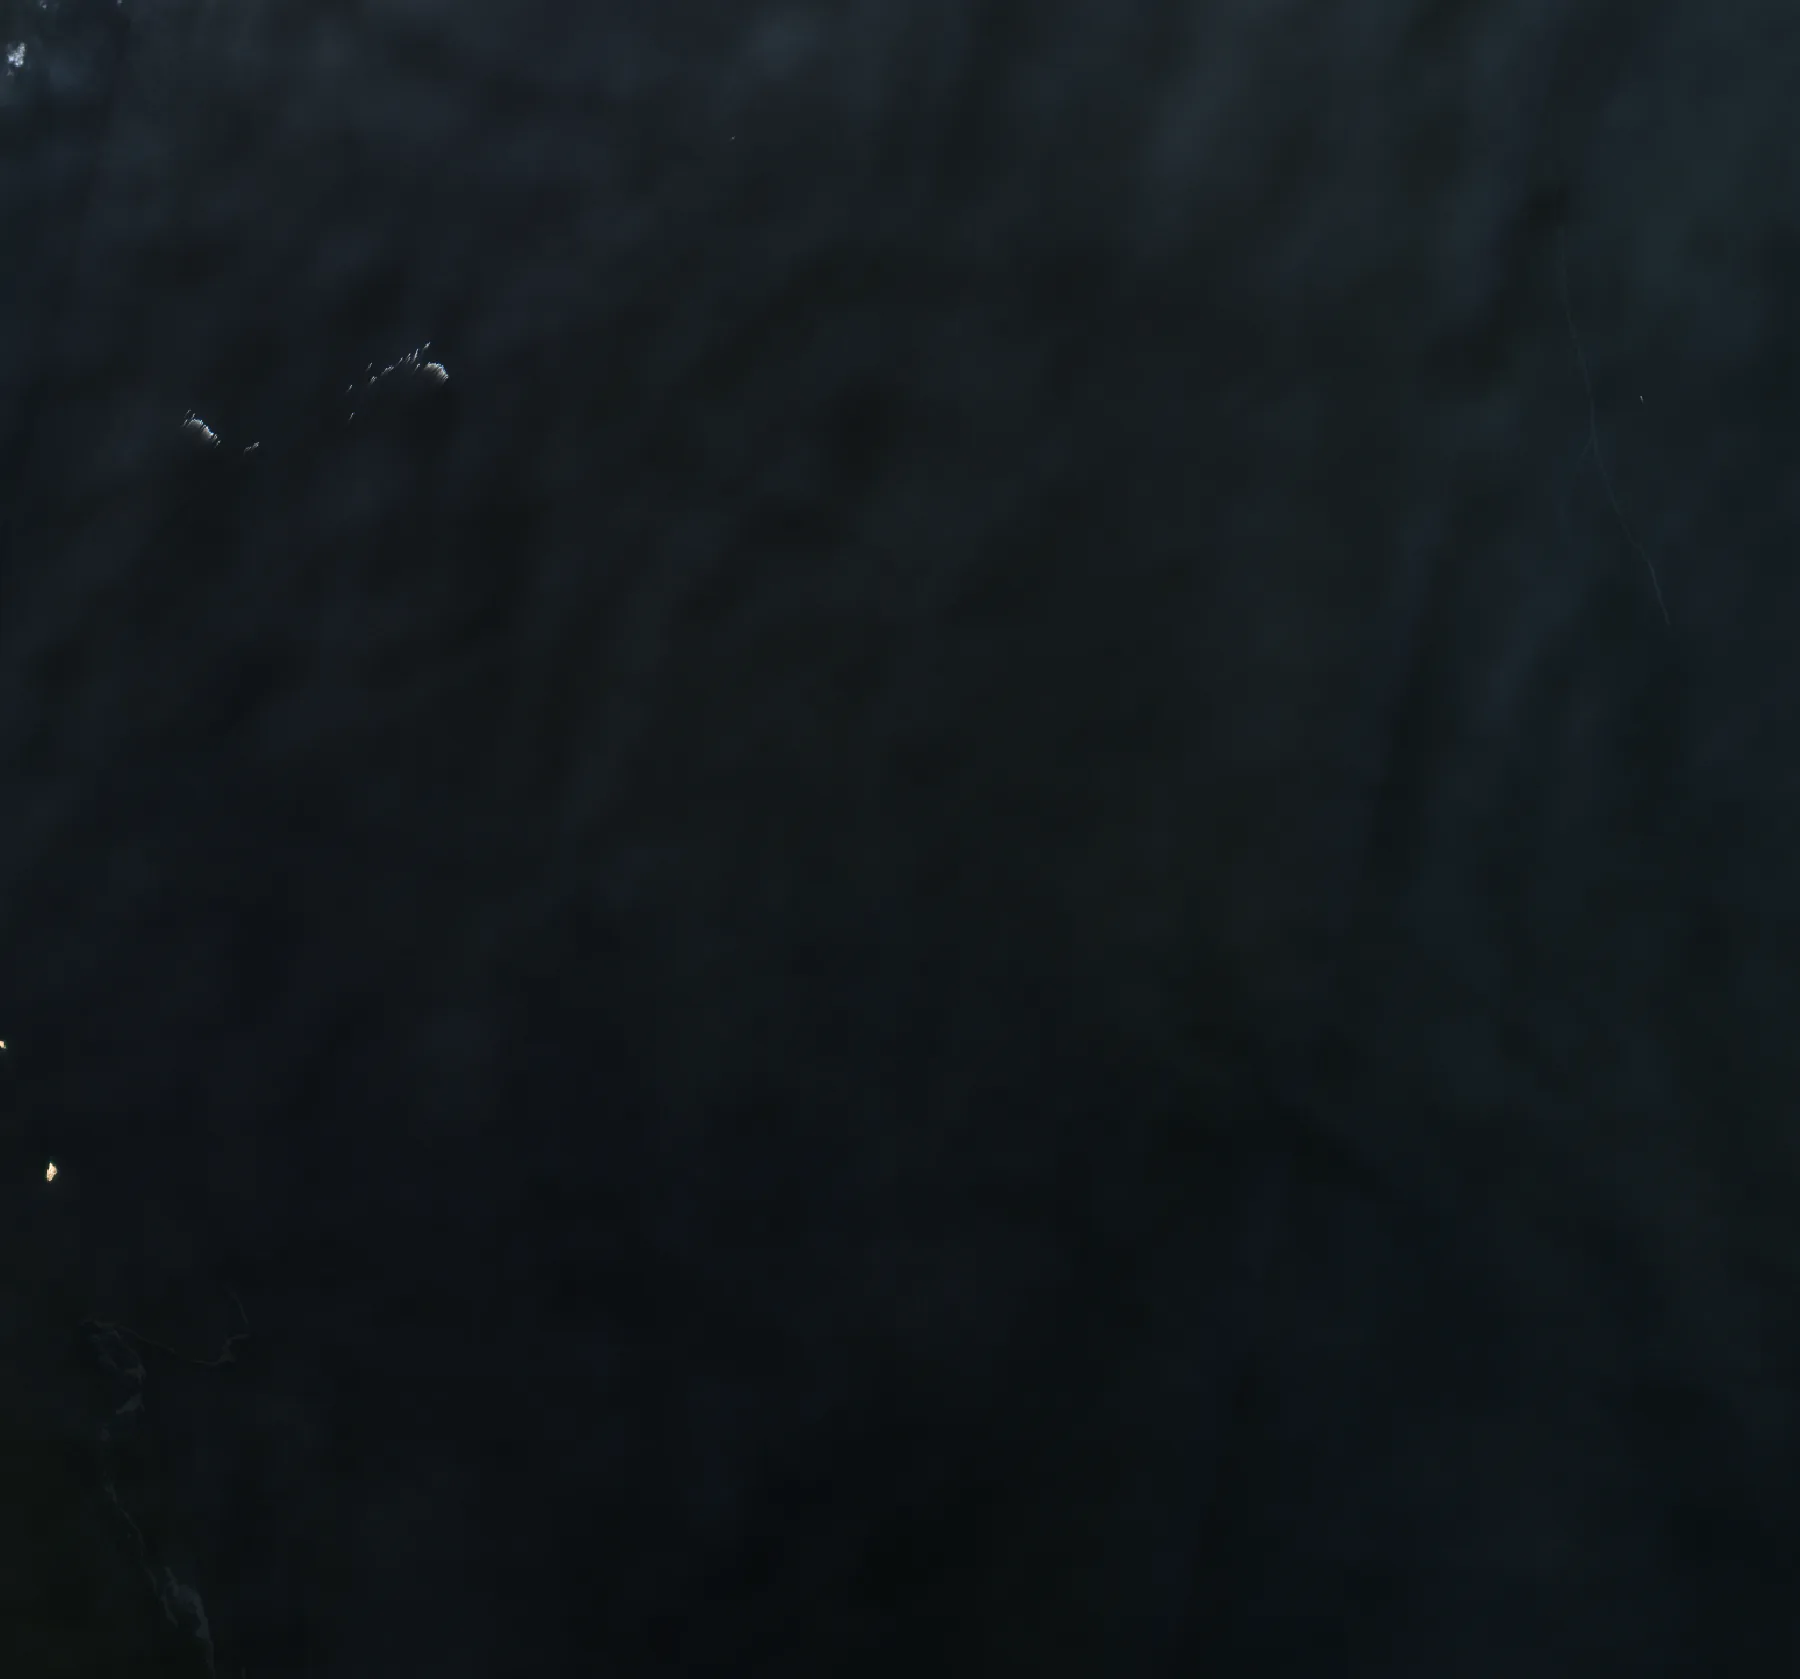
The close-up covers about 31 by 29 kilometres of open water east of the Quoin islands, where the inbound and outbound lanes run. Both pictures come from the same Sentinel-2 tile at the same time of day.
On 3 November 2025, at least 16 vessels are visible in the window. Each one is circled.
And on 3 November 2026
On 3 November 2026, no vessels are visible in the cloud-free part of the same window. Small clouds sit in its north-west corner, and the two islands at its left edge are the Quoin islands.
This is one window at one moment, not a count of the day's traffic. Ships cross a window this size in an hour or two, cloud hides part of the 2026 picture, and the window is not the whole strait. Iran says ships pass under IRGC coordination, which may mean other routes.
What a ship looks like in a free satellite picture
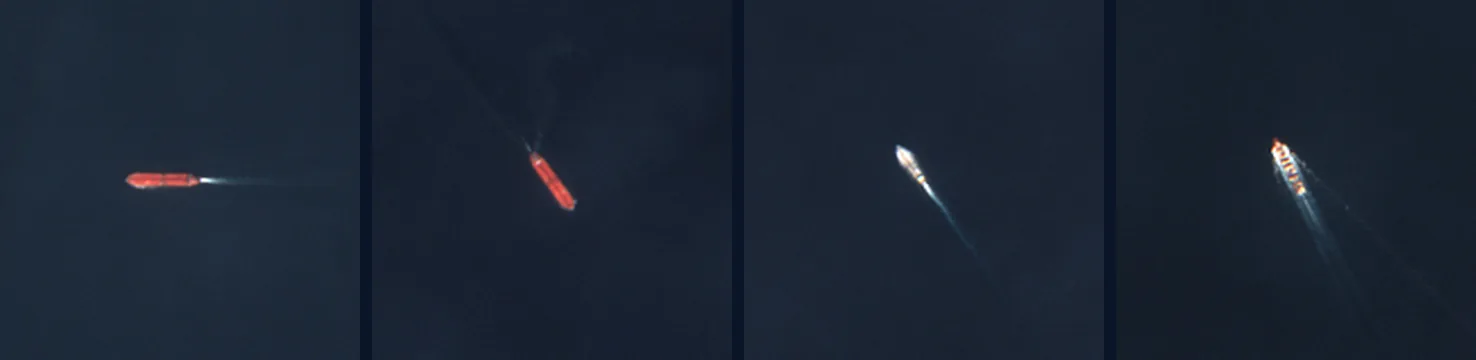
Sentinel-2's visible bands have a resolution of 10 metres (ESA). A large tanker is about 30 pixels long, usually with a wake behind it, like the four below from the 2025 picture. A fishing boat may be a single pixel, or nothing at all.
Why the ship counts in the news disagree
Most daily counts come from AIS, the radio transponders ships carry, and in this conflict AIS is unreliable. IMF PortWatch, whose counts several prediction markets settle on, warns of "GPS jamming, AIS spoofing, and vessels going dark" (IMF PortWatch). The US Energy Information Administration says AIS data for the strait have been "especially unreliable" since the end of February 2026 (EIA).
The official counts come from the two sides. Iran's IRGC Navy counts ships that pass under its coordination. US Central Command counts ships redirected under its blockade of Iranian ports. Neither is a count of all traffic.
Optical satellite pictures do not depend on AIS at all, but they only see what is clear of cloud at the moment of the pass. Radar satellites see through cloud. This page uses optical pictures only.
How Polymarket and Kalshi Hormuz markets settle
The Hormuz markets on both venues settle on IMF PortWatch transit calls. Those counts come from AIS, and PortWatch publishes them weekly, on Tuesdays at 9 AM Eastern (IMF PortWatch).
Polymarket's market on traffic returning to normal resolves Yes if PortWatch publishes a seven-day average of 60 or more transit calls on any date up to 31 December 2026 (Polymarket). Kalshi's weekly market adds up PortWatch's daily counts for the week and settles no earlier than the following Tuesday at 9 AM (Kalshi).
A satellite picture is not a settlement source for any of these markets. It shows whether ships are visible in the lanes on one pass, which is a different question from what PortWatch will report.
How much oil goes through the Strait of Hormuz
Before the war, about a fifth of the world's oil consumption. In the first half of 2025, 20.9 million barrels a day of crude oil and petroleum products passed through the strait. That was about 20% of global petroleum liquids consumption and a quarter of seaborne oil trade, along with more than 20% of global LNG trade, mostly from Qatar (EIA).
The latest quarter EIA has published is the second quarter of 2026: 4.9 million barrels a day of oil and 0.8 billion cubic feet a day of LNG, against 21.6 million barrels a day and 10.5 billion cubic feet a day in the last quarter of 2025. EIA says it revises these 2026 figures often, because of the AIS problems above (EIA).
A short history of closures and threats
1981 to 1988, the Tanker War: Iraq began attacking ships serving Iranian ports in 1981, and Iran began its own attacks in 1984 (US Naval Institute).
28 February 2026: US strikes on Iran begin (Al Jazeera).
Mid-July 2026: the US reimposes its naval blockade of Iranian ports and oil terminals (VOA).
25 August 2026: Iran and Oman announce a framework for a temporary joint navigation corridor and a joint mine-clearing project (gCaptain).
31 August 2026: two very large crude carriers loaded with Saudi oil are struck while outbound through the strait (gCaptain).
14 September 2026: regional talks on temporary entry and exit routes are postponed (Al Jazeera).
31 October 2026: CENTCOM says it has redirected 144 commercial vessels under the blockade (Middle East Eye).
How these pictures are made, and their limits
The pictures are true-colour Sentinel-2 Level-2A images from the EU's Copernicus programme, read from the open Earth Search catalogue. Sentinel-2 revisits a point every five days at the equator with two satellites, and in 2026 a third is still flying (ESA). Each picture is dated to its pass, not to the day this page was published.
Cloud, haze and sun glint hide ships, and small boats may not show at 10 metres. A picture shows one moment. It is not a daily transit total.
An EU decision has delayed Sentinel data by 24 hours since 13 July 2026, for a defined area of the Gulf of Oman east of the strait (Official Journal). The strait itself lies outside that area.
Ships circled in the pictures were checked by eye at full resolution. They are not an automated count.
Questions
Keep reading
Bab el-Mandeb tracker: satellite pictures of the southern Red Sea strait, and the route's status.
Gulf briefings: sourced analysis of Hormuz, the Red Sea and Gulf terminals.
Aureum Track: boards with a reading after each clear satellite pass.
Follow the Hormuz tracker
Get the strait's reading after each clear satellite pass, with the history kept in one place. Free to join during the beta.