News
China Grid Stress and AI Datacentres: Satellite Tracking
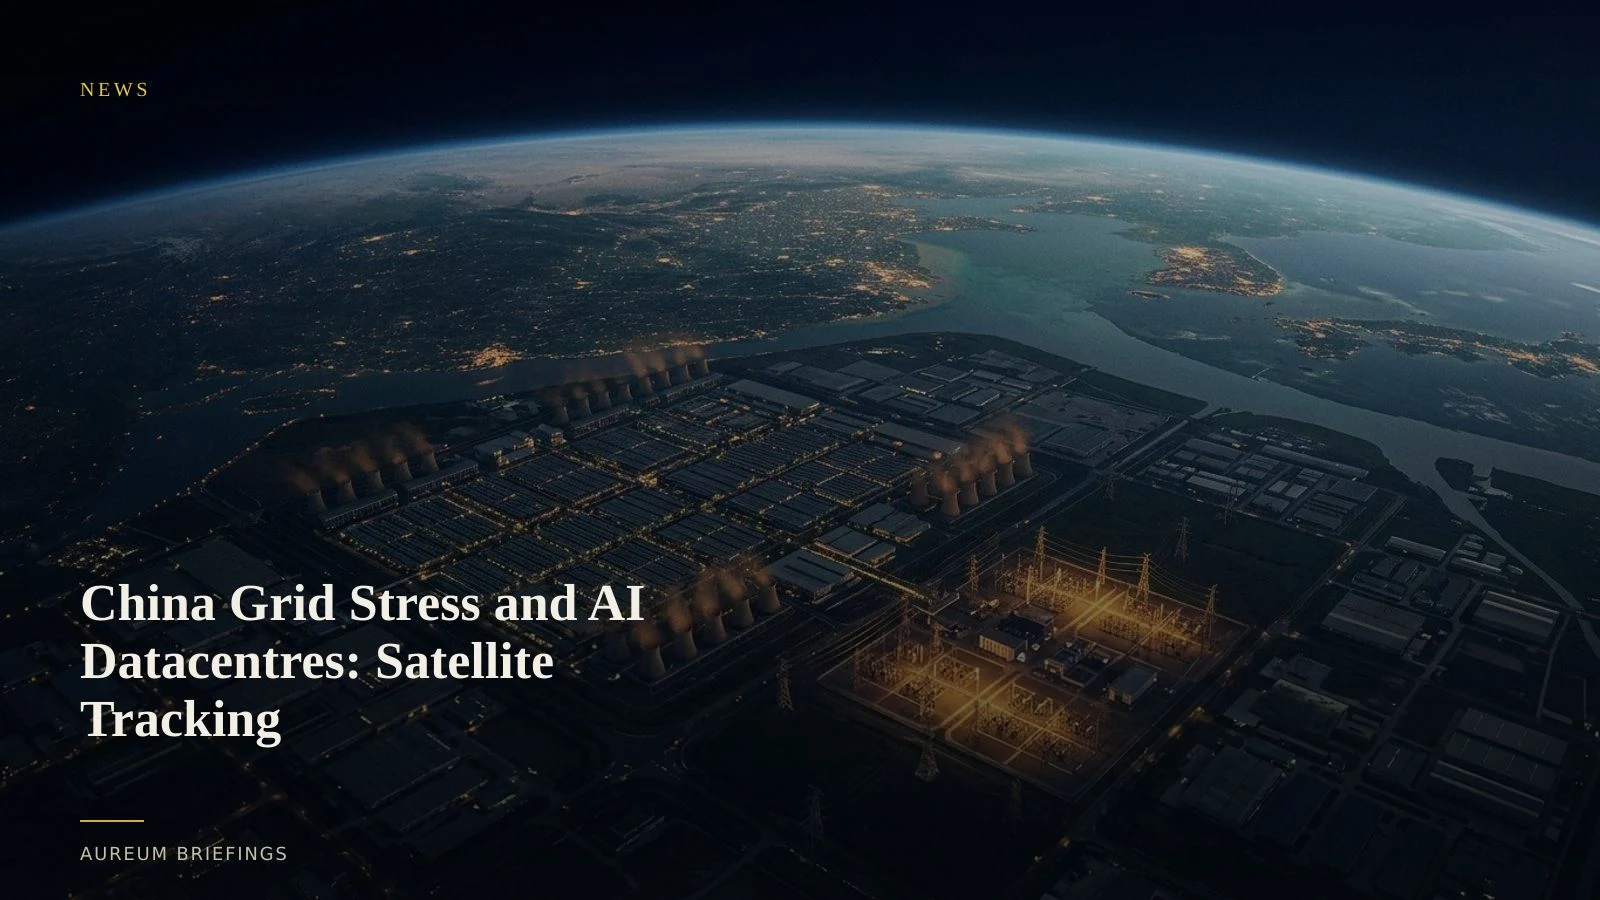
As artificial intelligence datacentres and intermittent renewables push energy grids toward operational capacity limits, physical satellite observation tracks hyperscale campuses and high-voltage substations before utility statistics print.
The grid bottleneck behind the AI boom
Power grid operators face unprecedented stress from two simultaneous pressures: rapid growth in intermittent renewable generation and massive electricity consumption from hyperscale artificial intelligence datacentres. Managing variable load while scaling high-voltage infrastructure requires monitoring physical assets as fast as regional grids expand.
According to recent energy market analysis on power grid stress from AI datacentres, modernising transmission networks with advanced controls and grid expansion is now a primary bottleneck for industrial technology growth. Meanwhile, broader geopolitical shifts, including Russia tariff and trade sanctions policy, continue to alter regional energy supply routes and equipment sourcing across Eurasia.
Verifying datacentre and substation footprints from space
Paper announcements of new datacentre campuses or grid upgrades frequently lag real-world ground conditions by months. Remote sensing through ESA Copernicus Sentinel satellite imagery allows traders and analysts to track land clearing, structural foundation progress, and high-voltage transformer installation directly.
Physical footprint expansion cannot be disguised on satellite radar or multi-spectral optical passes. Earth observation measures ground disturbance, substation transformer yards, and cooling infrastructure development across major technology corridors.
Institutional feeds versus accessible Earth observation
Enterprise geospatial platforms like SpaceKnow or Planet sell multi-site industrial tracking feeds at price points designed for enterprise trading desks. Independent traders and analysts without an internal GIS desk usually end up relying on outdated imagery in free web browsers that show sites as they were months or years ago.
Open programs managed by NASA Earthdata open remote sensing products provide consistent multi-spectral observation. When paired with structured analysis, these datasets reveal exact dates for structural completions and substation interconnections without expensive software setups.
Integrating physical evidence into market decisions
When energy traders and commodity analysts evaluate power grid constraints or tech hardware supply chains, relying solely on corporate press releases creates structural blind spots. Confirming actual site activity through space-based imagery replaces guesswork with verifiable physical evidence.
Using Query, you can ask a direct question about ground clearing, building envelope progress, or power substation civil works across target regions. For recurring monitoring across key energy hubs, Track delivers structured watchlist updates whenever new satellite passes land.
Who needs physical grid intelligence
Assessing power grid capacity and hyperscale industrial build-outs is vital for equity investors in power equipment, commodity traders monitoring regional power draw, and OSINT analysts evaluating infrastructure capacity.
Aureum opens institutional-grade Earth observation to every decision-maker who needs ground truth without maintaining a dedicated remote-sensing research desk.
Put physical grid intelligence to work
Free to join during the beta. Ask Earth a direct question about datacentre construction, power substations, or industrial energy assets.