News
China Export Freight Surges: Tracking Port Staging With Satellites
As factories race to ship finished goods before Golden Week, container yards at major Chinese export gateways are filling up. Here is how satellite radar verifies port congestion before spot rates jump.
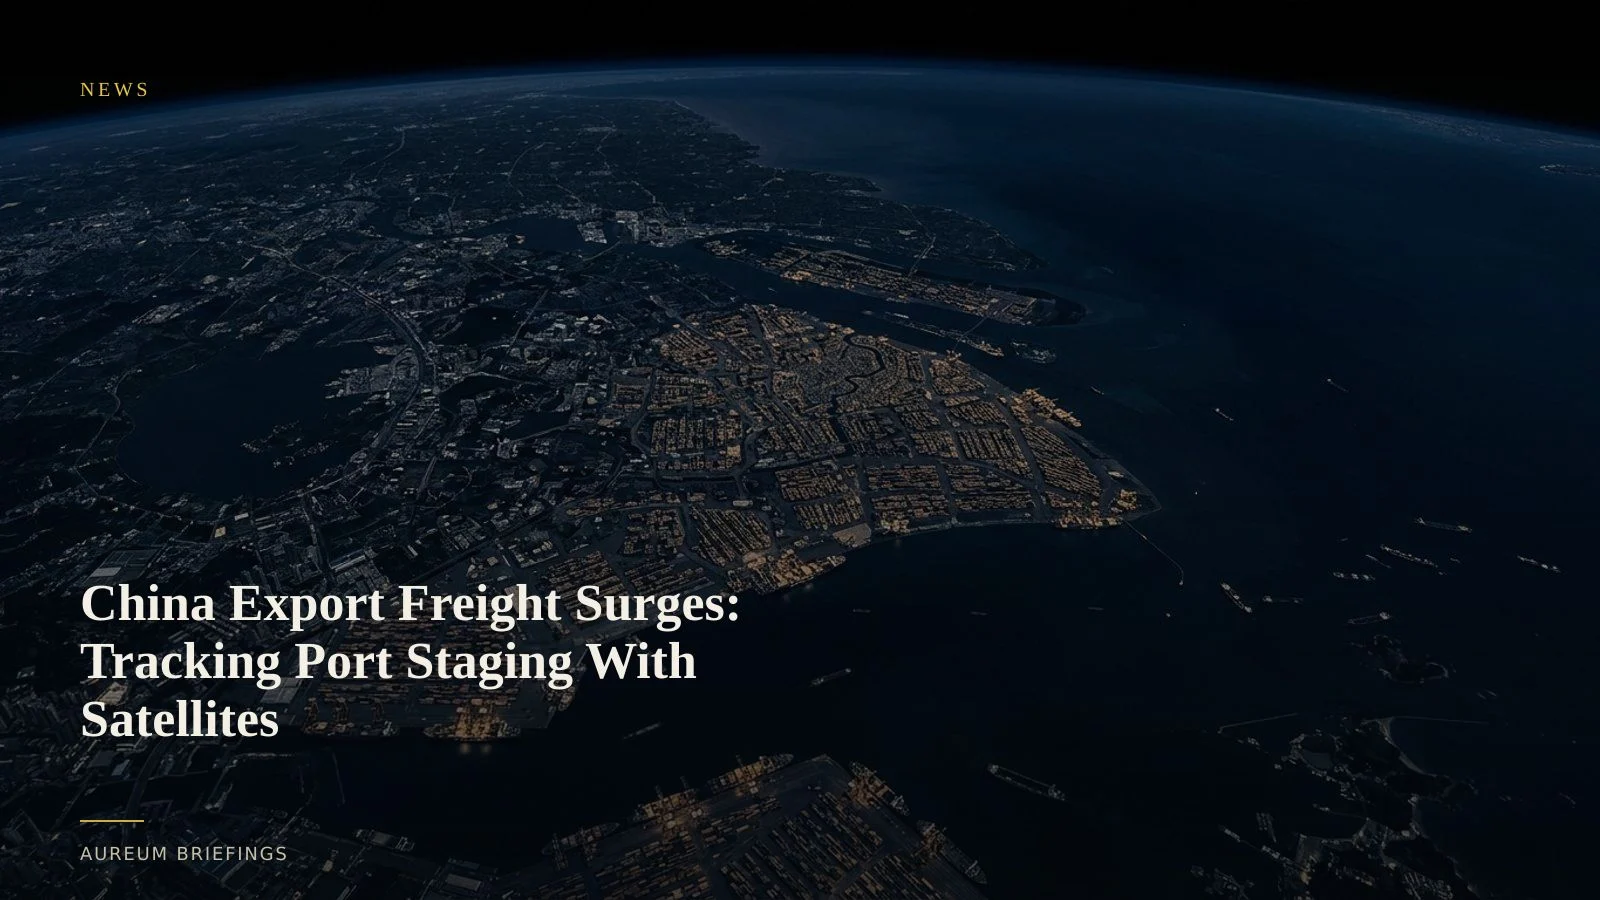
Pre-Golden Week surges compress vessel capacity
Global importers are facing sharp seasonal rate increases out of major Chinese terminals. According to recent China export shipping studies, exporters are rushing shipments ahead of China's National Day Golden Week holiday in early October, triggering vessel capacity bottlenecks and container staging delays.
When manufacturing hubs compress three months of order fulfillments into a tight four-week window, port yards fill rapidly. Importers and freight forwarders operating without a clear physical view are caught off guard when booking buffers vanish and spot container rates jump.
Relying on carrier announcements or delayed freight indexes often leaves traders reacting to news that was already priced into physical supply chains weeks prior.
Global trade corridor pressure compounds rate spikes
The seasonal surge out of Asia is unfolding against a backdrop of ongoing international trade reallocation. Broader geopolitical realignments highlighted in recent Atlantic Council analysis continue to reshape European trade corridors and industrial supply routes.
When global supply chains face persistent security and route adjustments, container equipment becomes unevenly distributed across global ports. Empty containers remain tied up in longer transit loops, making vessel slots at primary Asian hubs even more scarce during peak pre-holiday rushes.
To evaluate whether a freight rate hike is a brief seasonal blip or a structural port backlog, physical-economy traders look directly at container staging areas and vessel anchorages.
Verifying container stack density with satellite radar
Monitoring container staging requires more than checking public AIS transponder maps. When vessels idle in offshore anchorages or switch off transponders during congestion management, AIS feeds fail to reflect actual terminal density.
Synthetic aperture radar (SAR) provides physical verification regardless of cloud cover or darkness. High-frequency radar passes reflect off metallic container stacks, allowing analysts to measure stack volume, berth occupancy, and queue density at gateways like Shanghai and Ningbo-Zhoushan using public datasets from ESA Copernicus Sentinel imagery.
When physical container density reaches maximum yard threshold, spot market rates on benchmarks like the Freightos Baltic Index typically surge shortly after. Satellite observations capture that physical buildup with satellite-backed evidence.
How physical signals change the decision window
Without an internal remote-sensing desk, independent investors and commodity traders often wait for monthly port throughput prints or transport earnings reports. By then, physical bottlenecks have already influenced spot freight prices and retail supply chains.
Query allows you to ask targeted questions about terminal stack density, anchorage vessel counts, and corridor flow changes in plain language.
Meanwhile, Track maintains hand-built boards on named logistics hubs, surfacing updates when port congestion or yard occupancy crosses historical baselines.
Run satellite intelligence on Track boards
Free to join during the beta. Ask Earth a question about port activity, or follow named trade corridors on hand-built Track boards.