Guide
Connecting Satellite Imagery to Market Data
Latitude and longitude serve as the universal join index between physical assets and market positions. Here is how satellite data converts into actionable market signals.
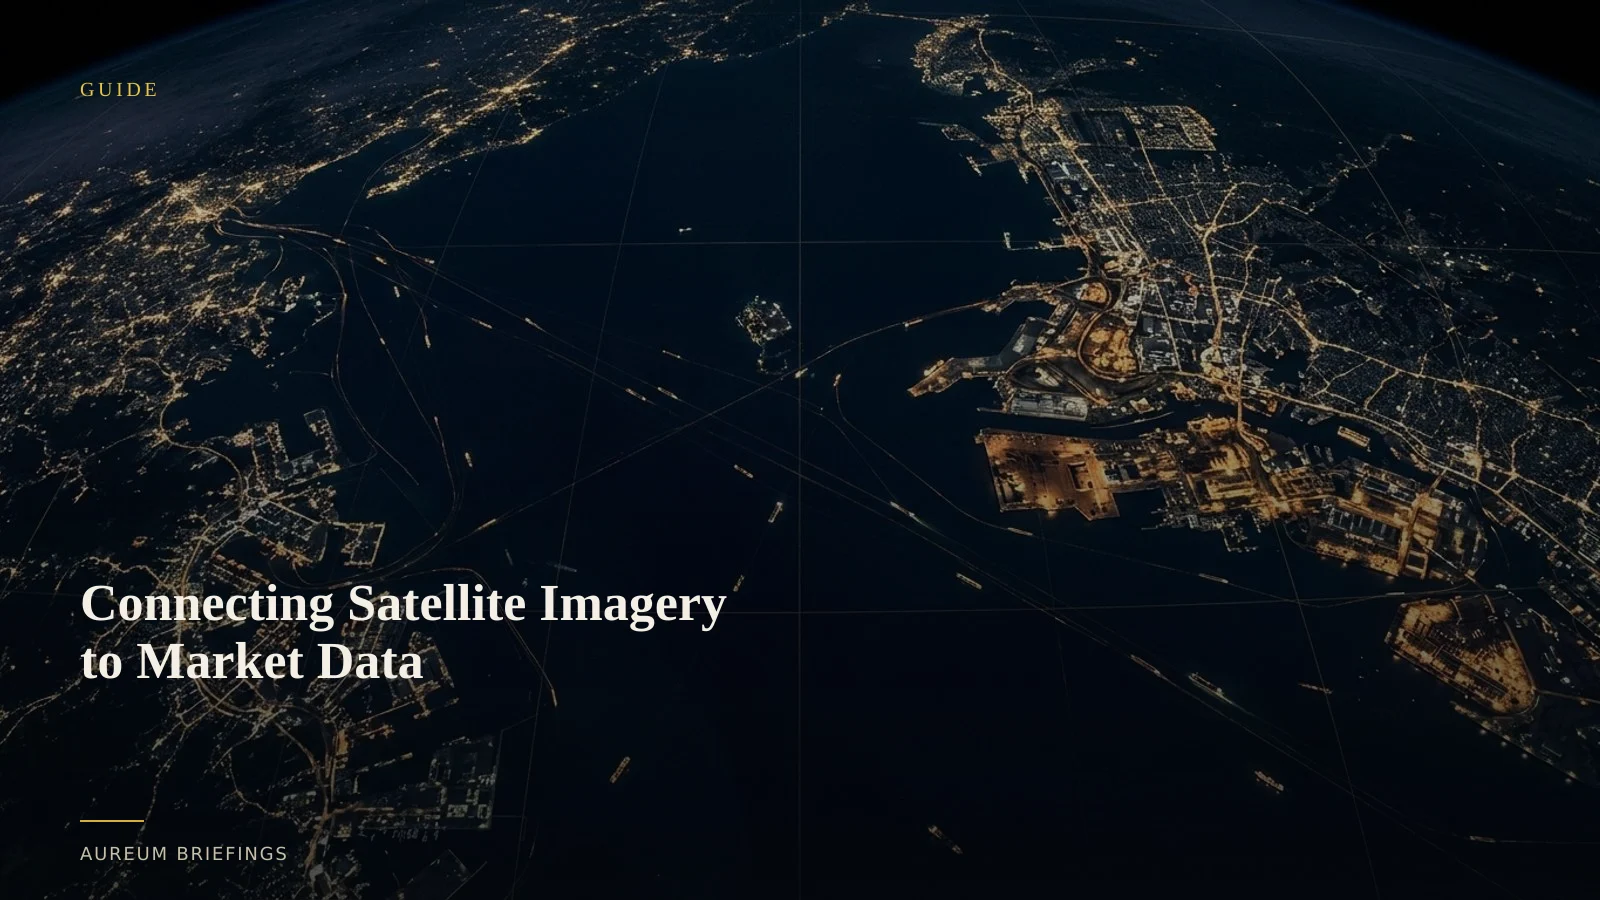
Coordinates as the universal financial join index
Every tangible asset driving the global economy has a specific physical location on Earth. Whether it is a crude storage tank in Cushing, an iron ore quay in Qingdao, or a soybean acreage in Mato Grosso, latitude and longitude form a permanent bridge between physical reality and financial tickers.
By treating coordinates as a join index, analysts can link overhead Earth observations directly to equity exposure, physical inventory, and commodity supply balances. When physical state changes at a specific coordinate, the market eventually recalculates the asset price.
How raw imagery translates into trade signals
Extracting tradeable insights requires matching the sensor to the physical observable. Optical feeds like open Sentinel-2 satellite data provide 10-meter resolution across multiple spectral bands, enabling vegetation index calculations to evaluate crop health weeks ahead of official production estimates.
For industrial facilities and energy infrastructure, specialised sensors reveal what optical passes miss. Floating-roof oil tanks cast measurable internal shadows that disclose fluid volume, while large commodity desks can afford commercial SAR tank metrics from vendors like Ursa Space; DIY investors usually cannot, so they fall back to free tools that only provide dated imagery without analysis, plus open flaring feeds. Meanwhile, thermal flaring data from NASA FIRMS highlights sudden shifts in upstream energy processing.
The bottleneck in self-built satellite analysis
Building a custom remote-sensing pipeline requires significant effort. A trader must ingest raw satellite tiles, correct for atmospheric distortion, filter out cloud cover, and write custom code to quantify localized activity.
While commodity desks can afford ordering spot scenes from high-resolution satellite imaging options, DIY investors usually cannot. Running Python on Sentinel-2 optical imagery and tank shadow methods can confirm isolated events, but those manual steps do not scale when you need many named assets checked together.
on-demand satellite intelligence with Query and Track
Instead of managing complex remote sensing scripts, Aureum translates global satellite streams directly into structured physical intelligence.
Use Query to run spot investigations on industrial facilities, farm clusters, or shipping chokepoints anywhere on the map. For persistent exposure, place those coordinates on Track boards to receive automated updates whenever key physical indices shift.
Start analysing physical market signals
Join the beta to run satellite queries and monitor physical economy KPIs across global supply chains.