News
Energy Grid Strikes and Maritime Sinks: Tracking Infrastructure Shocks
Kinetic disruptions across European power grids and Red Sea transit lanes are forcing energy markets to price rapid physical shocks. Satellite observation confirms what is happening on the ground.
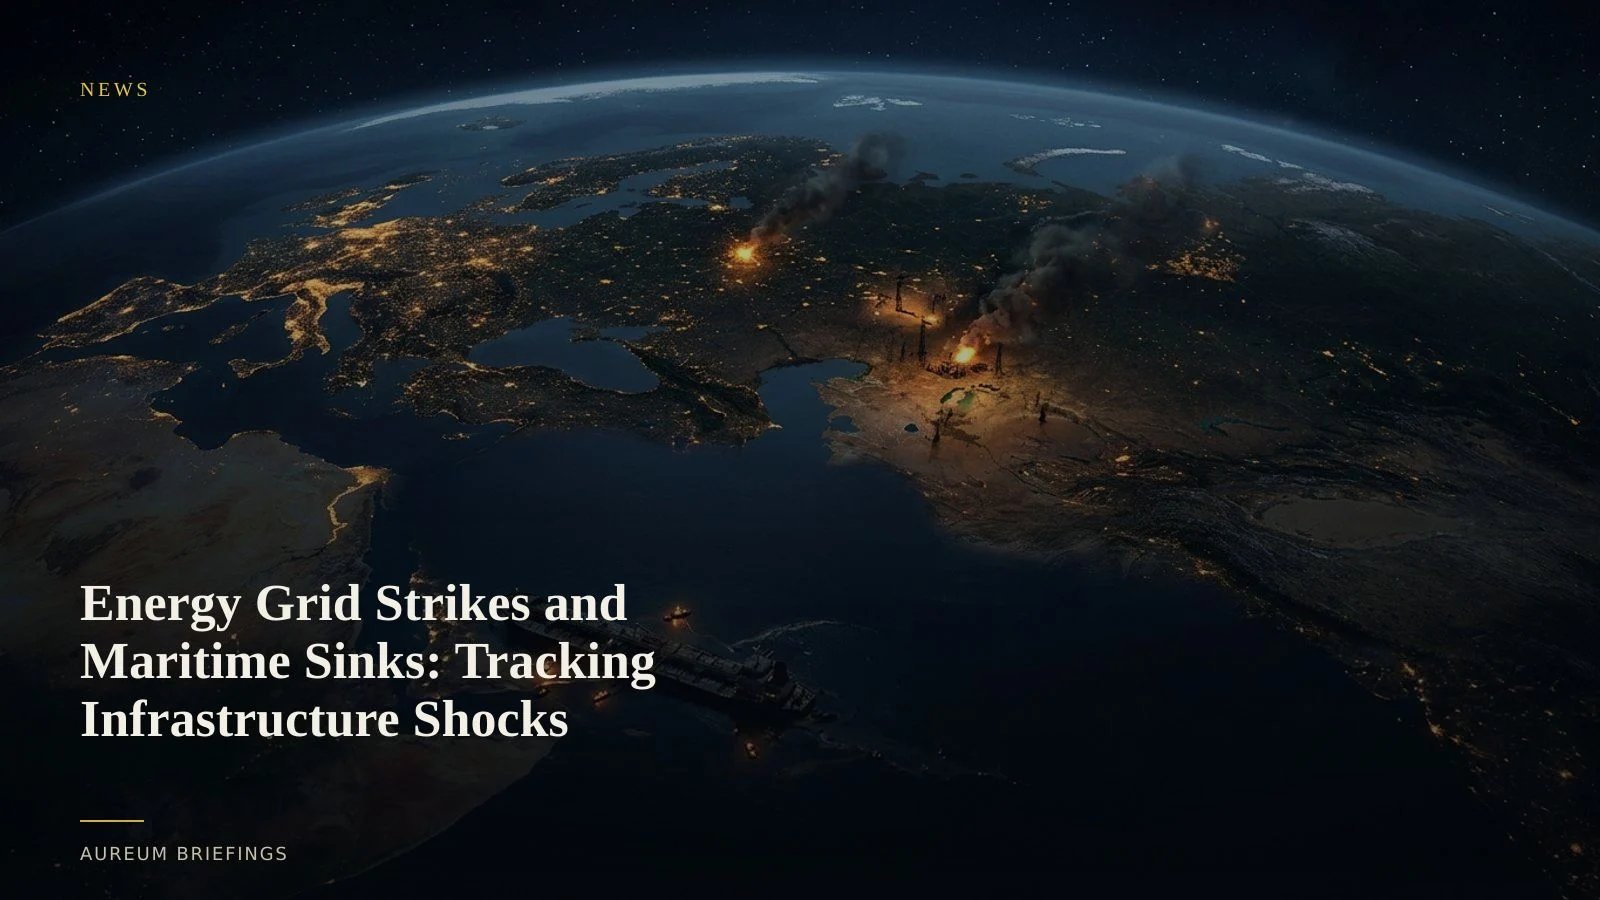
Simultaneous physical shocks to global energy infrastructure
Physical energy markets are confronting acute dual pressures across both fixed power infrastructure and maritime transit lanes. On 4 August 2026, the Indian-flagged cargo vessel MSV Faize Noore Oliya was struck by a projectile and sank off the coast of Yemen, marking a sharp escalation in commercial shipping destruction.
Concurrently, government officials warned of escalating ballistic strikes targeting critical power infrastructure across Eastern Europe ahead of the winter heating season. When physical assets face active military targeting, headline announcements often lag actual ground realities by hours or days.
For traders and commodity market participants operating without an internal satellite research desk, evaluating the true extent of power grid damage or maritime rerouting requires objective, space-based observation.
Verifying maritime losses beyond transponder signals
The sinking of the India-flagged cargo vessel MSV Faize Noore Oliya off Yemen highlights the limits of relying solely on vessel transponders. Automatic Identification System signals can be interrupted, disabled, or rendered useless when a ship suffers catastrophic structural hull damage.
Space-borne synthetic aperture radar provides high-resolution imaging through smoke, clouds, and darkness. Through ESA Copernicus Sentinel radar coverage, analysts monitor surface oil sheens, floating wreckage fields, and surrounding emergency response vessels in active maritime corridors.
This imagery allows market participants to verify whether a transit route remains usable or if nearby commercial traffic has instituted emergency evasive maneuvers.
Monitoring energy grid resilience and thermal footprints
On land, tracking power grid outages and transformer station damage requires synthetic aperture radar combined with night-time light sensors and thermal infrared imagery. NASA Earthdata satellite observations capture sudden drops in regional night lights and changes in thermal emissions around power generating facilities.
When long-range strikes hit regional substations, thermal sensors register immediate flame anomalies, followed by localized blackouts visible on subsequent night passes. This physical footprint confirms structural incapacitation well before official utility reports outline repair timelines.
By comparing pre-strike baselines with post-event passes, analysts assess whether energy generation can meet seasonal heating demands or if fuel flows must be diverted across secondary pipelines.
Incorporating space-based verification into trading workflows
Traders who monitor energy markets cannot afford to wait for official press briefings or delayed regulatory disclosures during kinetic crises. Satellite imagery converts unverified headline claims into spatial evidence.
Query allows you to ask targeted physical-world questions without navigating complex geographic information systems. Ask about facility thermal footprints, vessel staging, or corridor traffic to receive direct satellite-backed analysis.
Track maintains hand-built boards over critical global energy corridors and industrial facilities, updating when new coverage lands and ground conditions change.
Run the workflow yourself
Free to join during the beta. Ask Earth a question, or follow Track boards on named energy corridors.