Guide
Measuring Crude Oil Storage With Satellite Shadow Analysis
Floating-roof oil tanks disclose their volume through shadow length and radar backscatter. Here is how physical evidence turns into inventory insight before official prints.
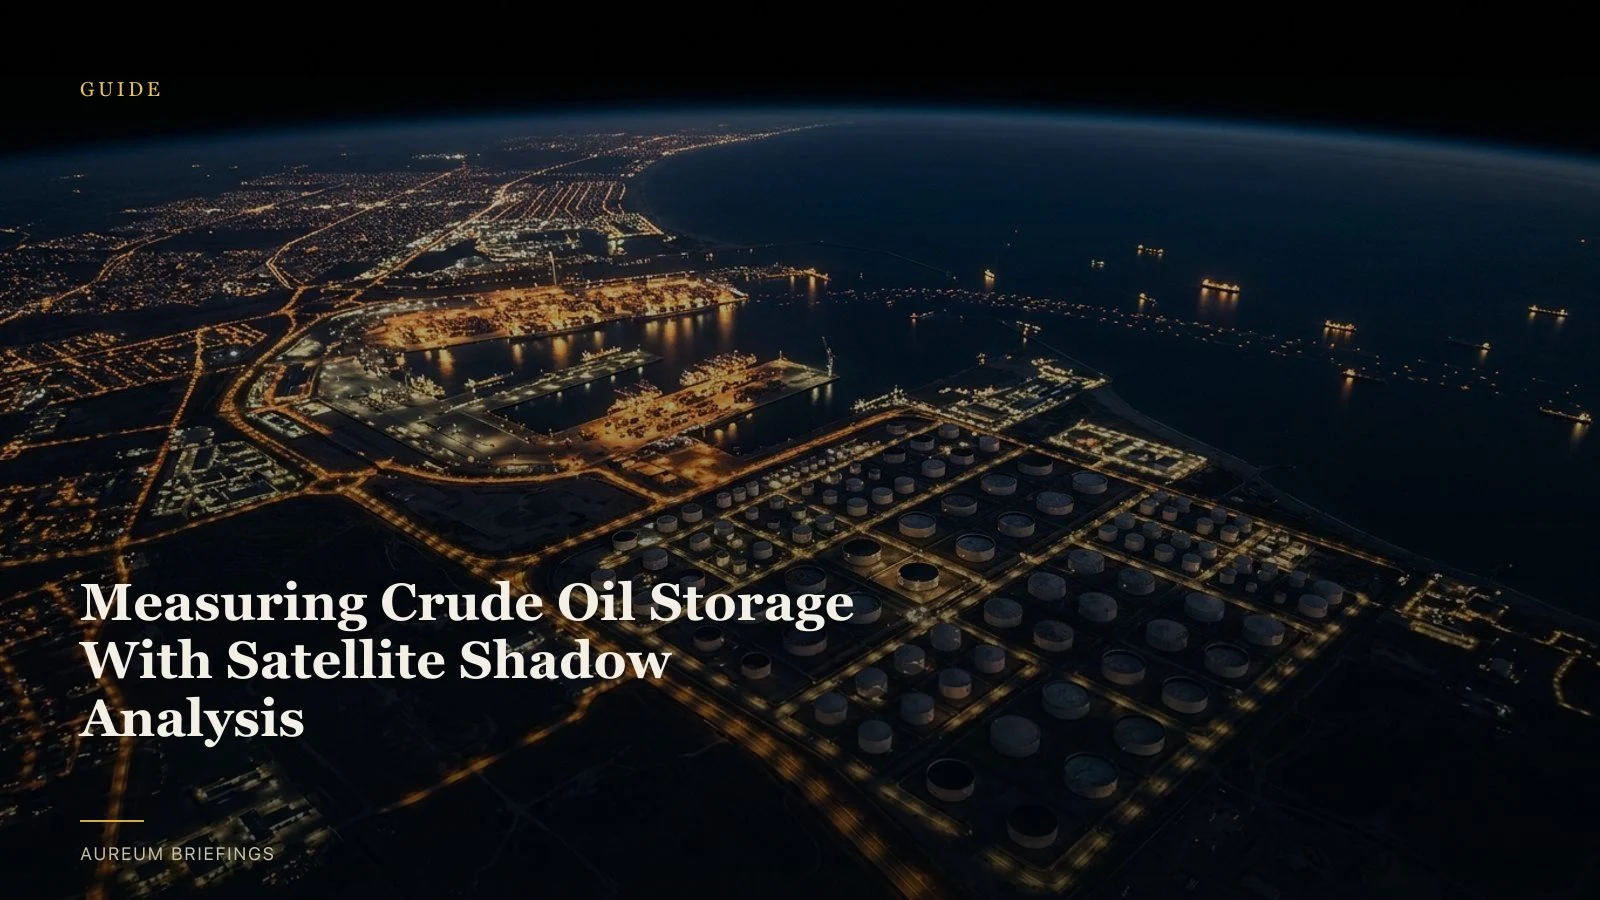
How floating-roof tanks reveal volume
Floating-roof storage tanks are designed to prevent vapour build-up by letting the roof rest directly on top of the crude oil volume. As crude enters or exits the cylinder, the roof rises and falls inside the shell walls.
When observed from orbit, this mechanical design creates a precise geometric signature. High-resolution optical imagery captures the interior shadow cast by the tank rim onto the floating roof, where shadow width correlates directly to roof depth.
By applying trigonometric analysis to floating-roof shadow geometry, analysts calculate the exact height of the fluid column weeks before national statistics or corporate releases summarise the data.
Verifying hub storage beyond official prints
In major pricing hubs like Cushing, Oklahoma, inventory shifts directly alter the spot price and futures curve structure for West Texas Intermediate crude. Understanding whether hub storage is building or depleting shapes spread trades and energy position sizing.
While institutions track Cushing oil storage capacity benchmarks through weekly government reports, those numbers reflect historical conditions rather than physical flows on the ground.
Combining shadow measurements across multiple tank farms provides an independent check on physical inventory trends, allowing market participants to verify supply claims without waiting for official publication cycles.
Overcoming cloud cover with synthetic aperture radar
Optical shadow measurement relies on clear skies and daylight, which presents obvious limitations in cloudy regions or winter months. To maintain continuous observation, physical economy monitoring incorporates synthetic aperture radar (SAR).
Radar sensors emit microwave pulses that penetrate clouds and light precipitation. Studies examining Sentinel optical and SAR sensor combinations show how complementary datasets resolve classification ambiguity across complex surfaces.
When applied to steel storage cylinders, SAR backscatter varies based on the exposed internal wall depth, providing consistent volumetric estimates even through overcast weather.
Combining satellite measurements with maritime feeds
Measuring storage tanks isolated from logistics flows leaves half the story untold. Tank farm inventory changes gain context when cross-referenced against inbound and outbound transport.
Following established OSINT multi-source verification practices means pairing satellite inventory estimates with vessel tracking and pipeline status. Seeing dark or anchoring crude tankers near export terminals explains sudden storage draws or accumulation.
Integrating satellite intelligence with maritime observations creates a reliable picture of real-world commodity movements that independent traders can verify on demand.
Satellite intelligence without an internal GIS team
For years, shadow analysis and radar backscatter processing were restricted to institutional funds with specialised remote-sensing teams and five-figure imagery budgets.
Today, DIY investors and commodity analysts can query physical sites and track critical inventory hubs using simplified interfaces that handle sensor calibration, cloud masking, and shadow math automatically.
Start with what you need to answer. Whether evaluating oil storage levels, port traffic, or industrial activity, satellite-backed analysis delivers real-world clarity when markets react to physical reality.
Run the workflow yourself
Free to join during the beta. Ask Earth a question about crude storage, or follow Track boards on named energy hubs.