Guide
Tracking Crude Steel Output With Satellite Radar
Official monthly steel production figures lag reality by weeks. Here is how satellite radar and thermal imagery reveal mill run rates before market prints.
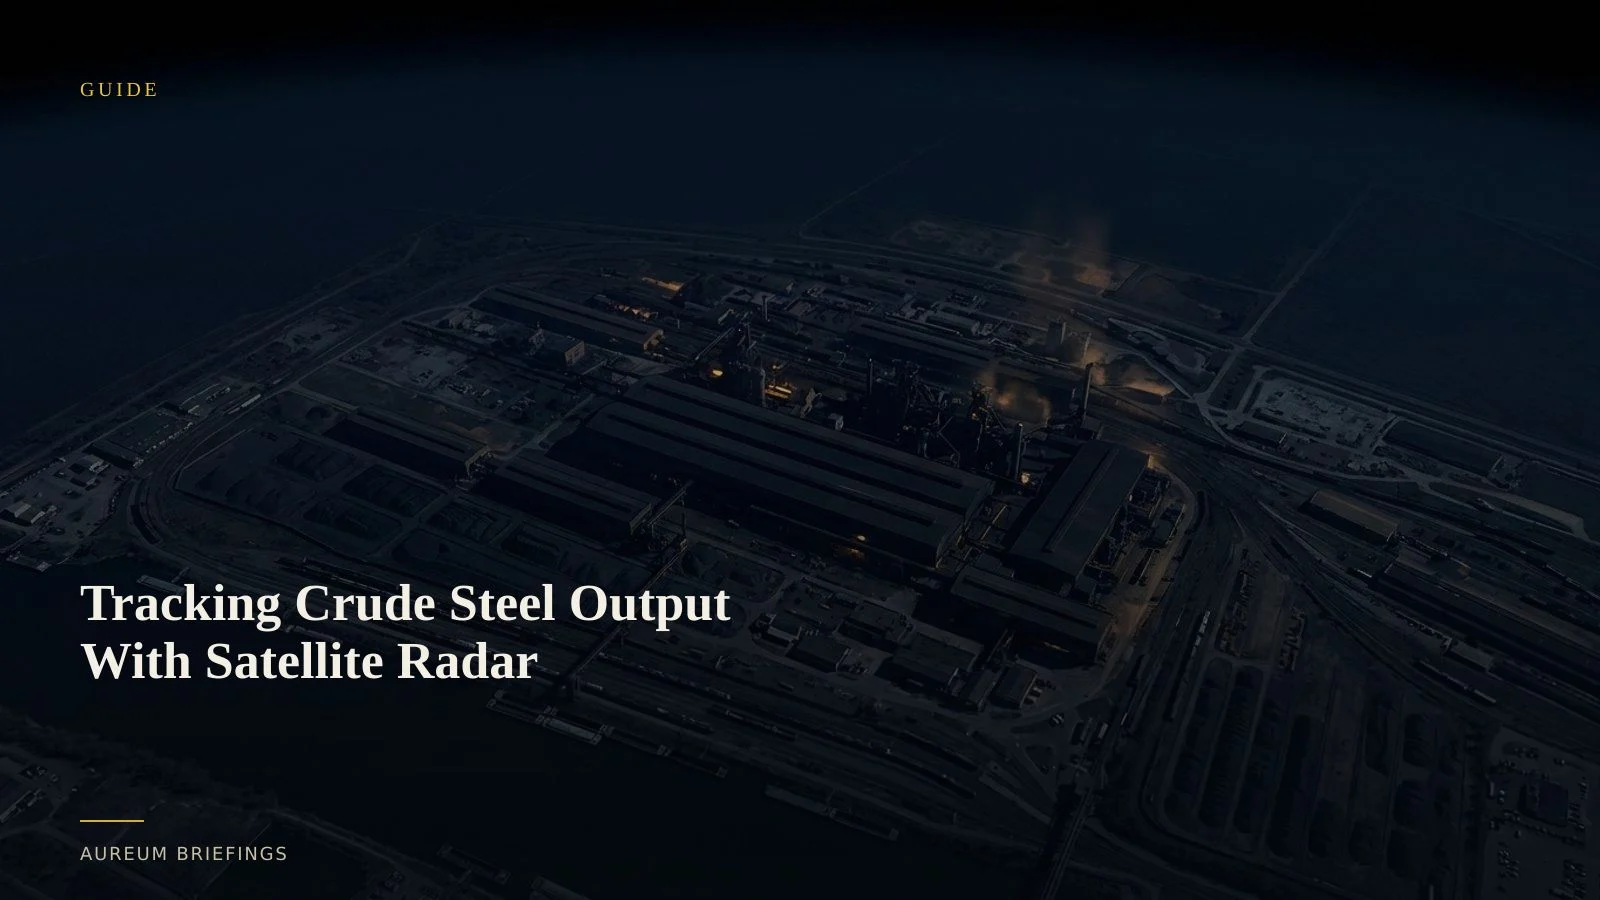
The trade lag in official steel prints
Official industrial reports provide essential baselines, but they inevitably describe past activity. When worldsteel crude steel statistics report monthly global output totals, the underlying blast furnace runs, raw material consumption, and yard movements took place weeks earlier.
For market participants evaluating steel producer equities, iron ore contracts, or coking coal shipping demand, relying solely on official monthly releases creates an information delay.
Measuring physical asset activity at major steelmaking hubs directly from orbit bridges that gap long before industry summaries are compiled.
Combining radar and optical observation
Observing steel mill activity from space requires multi-sensor earth observation. Synthetic Aperture Radar (SAR) sensors, such as those operated within ESA Earth observation satellites, penetrate cloud cover and nighttime conditions to map structural features across industrial yards.
SAR backscatter returns reveal inventory accumulation in raw material pads and finished steel storage lots, while optical imagery provides clear visual verification when weather permits.
While institutional commodity trading desks historically built proprietary teams to process raw imagery, retail investors and independent traders can now access these same physical signals through accessible satellite intelligence.
Measuring stockpiles and furnace operations
A integrated steel facility presents distinct physical operational signatures. Satellite elevation measurements track volume changes in scrap metal and iron ore stockpiles, indicating whether raw inputs are being drawn down into active production.
Thermal infrared observation confirms whether basic oxygen furnaces and electric arc furnaces are actively firing or offline for maintenance. Combining raw material drawdown rates with thermal activity provides a direct proxy for mill utilisation.
This structural measurement prevents traders from misinterpreting administrative maintenance announcements or unverified market rumours.
Establishing physical baselines across time
Open spatial monitoring practices showcased by initiatives like Global Forest Watch land analysis prove how long-baseline spatial datasets highlight subtle physical trends over time.
Applying similar continuous temporal analysis to industrial complexes allows analysts to establish baseline activity levels for specific steel mills, industrial parks, and port export berths.
When yard activity or slag pile growth departs from multi-month averages, traders receive early physical evidence of production curtailments or ramp-ups.
Satellite analysis without a GIS team
Extracting actionable physical intelligence from industrial sites no longer requires acquiring raw orbital datasets or operating complex spatial analysis software.
Using Query, you can ask specific questions about mill status or stockpile volumes in plain English and receive evidence-backed answers in minutes.
For ongoing monitoring, Track provides hand-built KPI boards on key metal and energy complexes, delivering clear physical metrics whenever new satellite coverage arrives.
Track the physical economy from space
Free to join during the beta. Query a steel hub, or follow raw material flows on a Track board.