Guide
Tracking Grid-Scale Battery Storage Buildouts With Satellites
As utility-scale battery deployment accelerates, official grid capacity data lags behind physical earth changes. Here is how satellite observation verifies facility construction and battery supply flows before reports publish.
Grid expansion moves faster than reporting cycles
Utility-scale battery storage capacity has expanded at a rapid pace, with the US power system adding gigawatts of nameplate storage in recent quarters according to EIA utility-scale battery inventory statistics. However, monthly electric generator filings lag physical site commissioning by weeks or months.
For traders watching regional power pricing, spark spreads, and battery raw materials, relying purely on delayed government surveys leaves a visible knowledge gap. Physical ground changes happen well before official documentation prints.
What satellite observation reveals on the ground
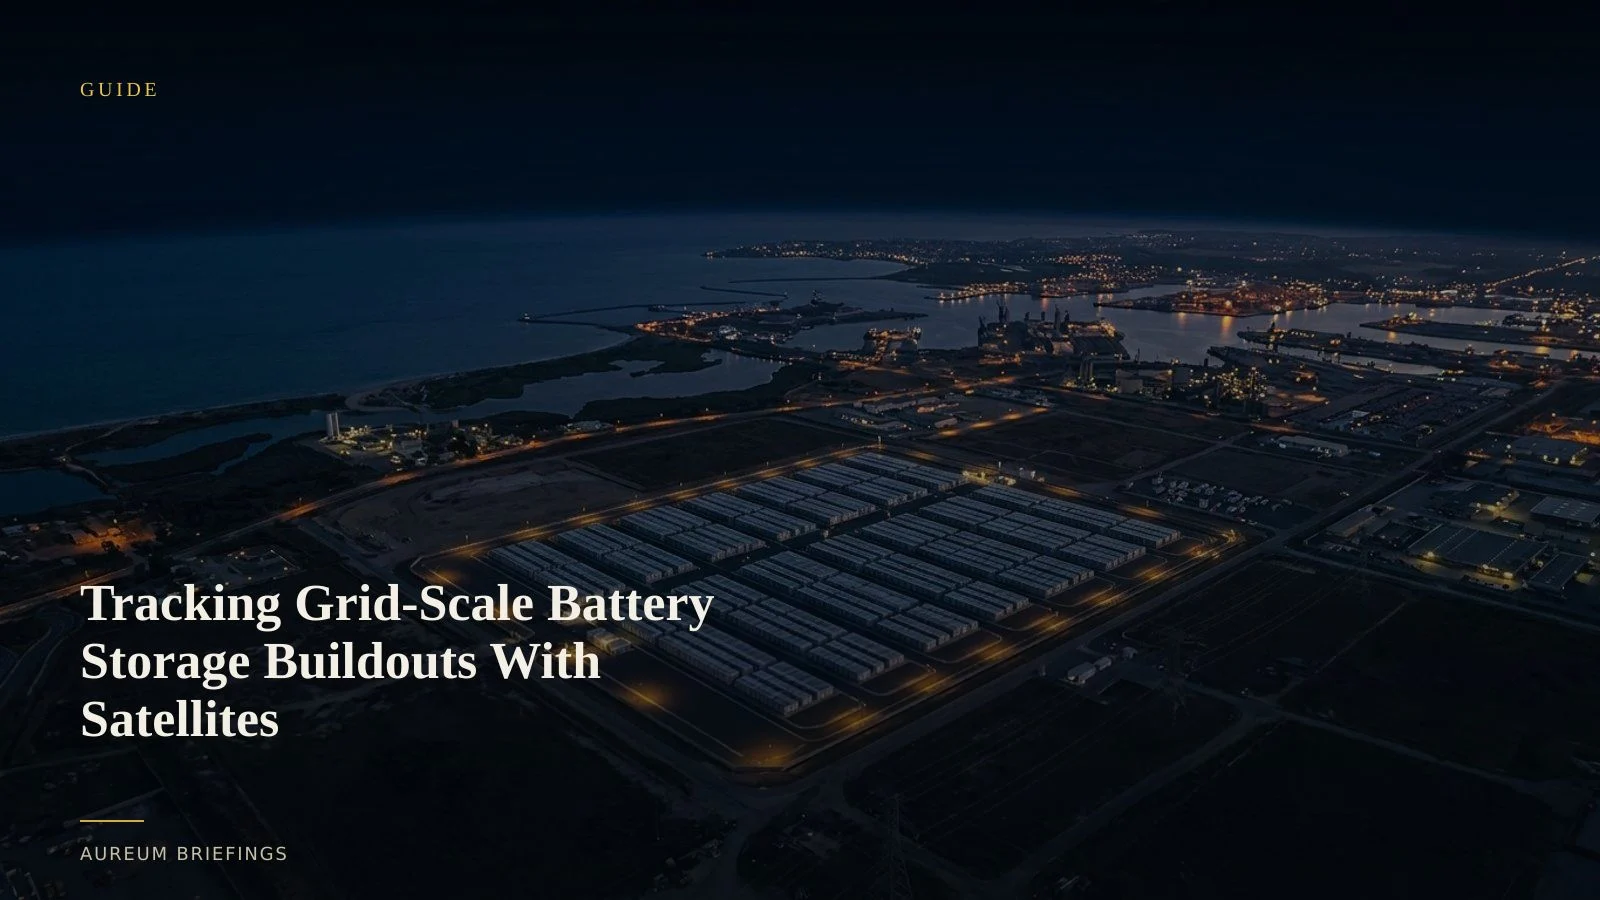
Grid-scale battery installations leave distinct physical footprints. Modular battery enclosures, inverter skid pads, high-voltage transformer substations, and earthworks appear clearly on optical and radar imagery.
Using open imagery from sources like ESA Copernicus Sentinel satellite data, analysts can observe ground preparation, pad pouring, container delivery, and interconnection activity at planned battery sites long before commercial operation is formally logged.
Connecting storage expansion to upstream raw materials
Tracking downstream battery installations is only half the equation. The rapid build-out of utility-scale storage directly feeds into demand for battery metals like lithium, nickel, and cobalt.
By combining facility tracking with upstream monitoring of evaporation ponds and processing yards, investors can verify whether material supply is keeping pace with grid-scale storage additions.
Satellite-backed analysis without an enterprise GIS desk
Large energy firms and quantitative desks often employ specialised teams to process satellite feeds. Individual investors and independent traders usually fall back to free consumer maps that display outdated imagery without analytical context.
Aureum bridges this gap. Query provides clear satellite-backed answers with recent visual proof when you need to inspect a specific facility. Track delivers hand-built KPI boards on key infrastructure corridors so you can observe physical shifts as they develop.
Built for physical economy decision makers
This approach is designed for anyone taking positions or making operational decisions around energy grid transitions, power markets, or battery metals.
Whether you are evaluating regional electricity volatility or assessing commodity demand, satellite-backed verification gives you actionable evidence grounded in physical ground reality.
Verify grid infrastructure with satellite evidence
Free to join during the beta. Ask Earth a question with Query, or follow curated Track boards on named infrastructure sites.