Guide
Tracking Iron Ore Stockpiles and Terminal Discharges With Satellites
Metals traders know that official import statistics and industry forecasts lag physical supply chain shifts. Here is how satellite observation measures raw material flows before the headline prints.
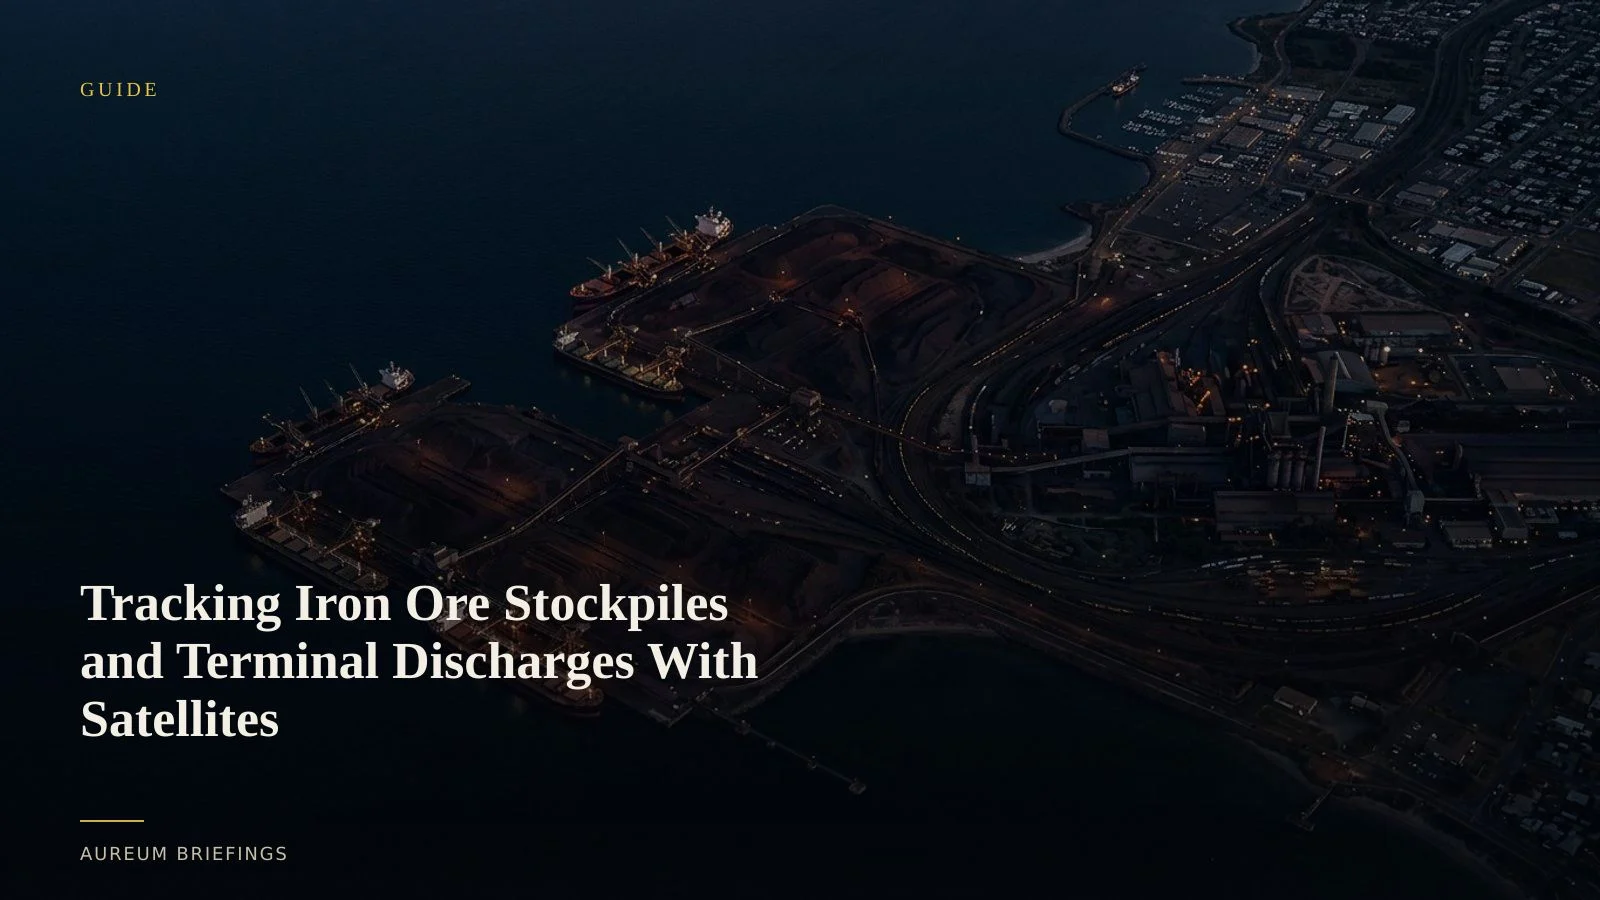
The delay between vessel discharge and official statistics
When capesize vessels arrive at major bulk import terminals in Caofeidian, Qingdao, or Ningbo-Zhoushan, iron ore stockpiles shift long before monthly customs declarations update.
Traders who rely solely on lagging reporting must react after prices adjust. The physical economy leaves clear, measurable footprints in the real world, from open-air ore storage footprint expansion to conveyor system activity and berth queue volume.
Tracking raw material buildup or drawdowns gives market participants physical verification of industrial demand changes before official trade conferences or regional reports release.
How satellite observation quantifies dry bulk storage
Measuring iron ore piles requires combining optical imagery and radar observations across named import hubs and inland storage yards.
Optical imagery captured by public constellations like ESA Copernicus Sentinel satellites provides multispectral imagery that delineates raw material pile surface area and shadows.
When cloud cover obscures port operations, Synthetic Aperture Radar (SAR) penetrates weather layers to track vessel movements along berths and monitor crane activity at bulk terminals.
Verifying production signals against trade reporting
Industry updates presented at global gatherings such as the worldsteel international congress reports offer structural perspectives, but short-term price movements depend on immediate inventory swings.
Combining port storage measurements with vessel fixtures recorded by Baltic Exchange shipping statistics reveals whether bulk shipments are absorbing into immediate production or building up at coastal facilities.
When terminal stockpiles surge while inland rail staging remains subdued, it indicates cooling mill intake, giving traders actionable insight into raw material balance shifts well ahead of monthly production reports published by USGS NMIC mineral statistical publications.
Replacing scavenger hunts with curated intelligence
Without targeted satellite tooling, market analysis often devolves into manual ship tracking refreshes, outdated mapping photos, and fragmented news commentary.
Institutional commodity desks historically spent millions building proprietary geospatial processing pipelines to analyse iron ore and steel raw material stocks. DIY investors and independent analysts were left waiting for public summaries.
Aureum bridges this gap by delivering satellite-backed answers through Query and offering hand-built KPI boards on key trade hubs via Track.
Start monitoring physical commodity flows
Free to join during the beta. Follow curated Track boards across global commodity corridors or query specific industrial assets.