Market Briefing
Tracking Pacific LNG Exports With Multi-Modal Satellites
When new natural gas export facilities start up along the Pacific Coast, berth occupancy and flaring disclose operational reality before official market data catches up. Here is how multi-modal satellite tracking confirms physical loadings.
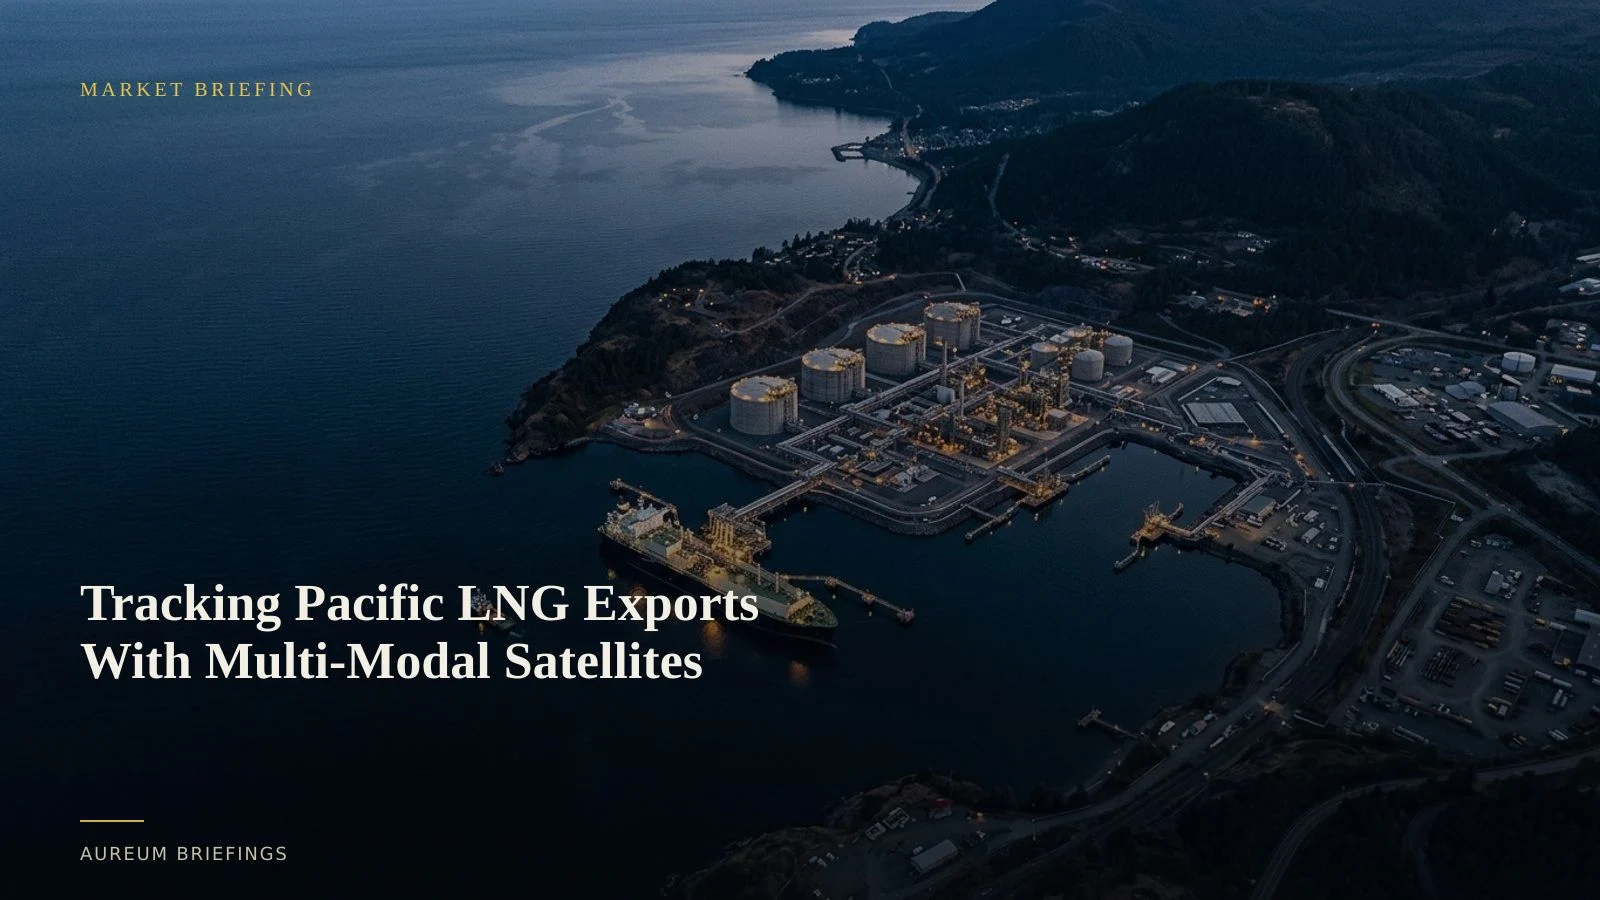
The Pacific export shift and the reporting delay
Liquefied natural gas markets are adjusting as Pacific Coast export capacity grows. Facilities like Mexico's Energia Costa Azul terminal now allow direct shipments to Asian importers without navigating Panama Canal bottlenecks or circuitous Cape routes.
Official export figures and custom manifests, such as recent EIA updates, report terminal completions and cargo departures days or weeks after the physical event.
For independent traders, waiting on published trade summaries creates an information gap. Physical export volume moves spot gas pricing and shipping charter rates before public logs confirm a single vessel departure.
Cutting through coastal cloud with cross-modal radar
Monitoring coastal energy infrastructure presents immediate physical hurdles. Pacific marine fog, cloud banks, and atmospheric haze regularly obscure standard visible satellite imagery over marine terminals.
To solve this, advanced Earth observation uses cross-modal combinations of optical imagery and Synthetic Aperture Radar (SAR). Recent peer-reviewed research on cross-modal SAR and optical target detection demonstrates how radar module enhancement overcomes cloud cover and noise to pinpoint vessel hulls and cryogenic loading structures.
SAR pulses penetrate weather day and night. When combined with optical passes on clear days, multi-modal analysis distinguishes between an empty berth, a docked carrier taking on cargo, and cold-standby maintenance flaring.
Reading physical supply balances before consensus prints
Global gas traders constantly weigh macroeconomic oversupply fears against sudden regional supply contractions. Large institutions can afford commercial SAR energy monitoring from vendors like Ursa Space; DIY investors usually cannot, so they fall back to free tools that only provide dated imagery without analysis. Aureum turns the physical check into a satellite-backed answer so you can evaluate whether reported terminal commissioning delays look like real operational stops or temporary scheduling pauses.
A single imagery pass is never the whole answer. Evaluating real changes requires observing vessel arrivals, monitoring cryogenic storage tank insulation activity, and tracking flaring volume across consecutive orbits.
By grounding physical supply claims in earth observation, market participants can price regional supply additions accurately rather than relying on unverified press announcements.
How independent investors access institutional satellite analysis
In the past, running multi-modal satellite analysis required hiring specialised geospatial analysts, processing complex SAR radar layers, and negotiating enterprise imagery contracts.
Without a research desk on payroll, retail investors were left relying on stale satellite tiles or public social media rumors.
Aureum changes this workflow. Query processes natural language prompts against verified satellite coverage, while Track maintains hand-built watchlists on key energy corridors and marine terminals so you can decide with confidence.
Start tracking the physical economy
Free to join during the beta. Ask Earth direct operational questions, or follow Track boards on named energy corridors.