Lithium ponds
See pond growth before the filing.
For DIY battery and EV investors. Track built brine-pond hectares when the ground changes, not when the next slide deck lands.
Watchlist
1 signal
The problem
Why lithium theses stall today.
The ground moves first.
Pond pads expand, dry, or stall months before a tidy 10-K line item catches up.
The DIY stack is painful.
Copernicus Browser, Google Earth screenshots, filings, then a thread on X. No comparable time series.
Institutional feeds stay out of reach.
Specialist EO is built for desks. DIY investors are often left with free imagery that was never shaped for investment analysis.
Aureum's solution
Collapse the stack into one watch.
A pond KPI that updates.
You get a pond-footprint KPI that updates when coverage lands, rather than a one-off scene to file away.
Desk-ready, without a GIS seat.
The method is already productised. You do not need a custom change-detection notebook to watch the cohort.
See hectares before the filing.
Capacity growth often shows up as hectares first. Query handles the site exception when something looks off.
How it works
Watch the ponds. Catch the move early.
Put lithium on the board.
Open the growth-cohort pond KPI beside other physical-economy Track boards.
Follow built hectares on Track.
Optical change detection summarises footprint drift when new coverage lands.
Query the exception.
When a site looks off, ask Query for evidence in minutes, then decide with the rest of your process.
Follow lithium supply on Track.
A short walkthrough of Track for this job.
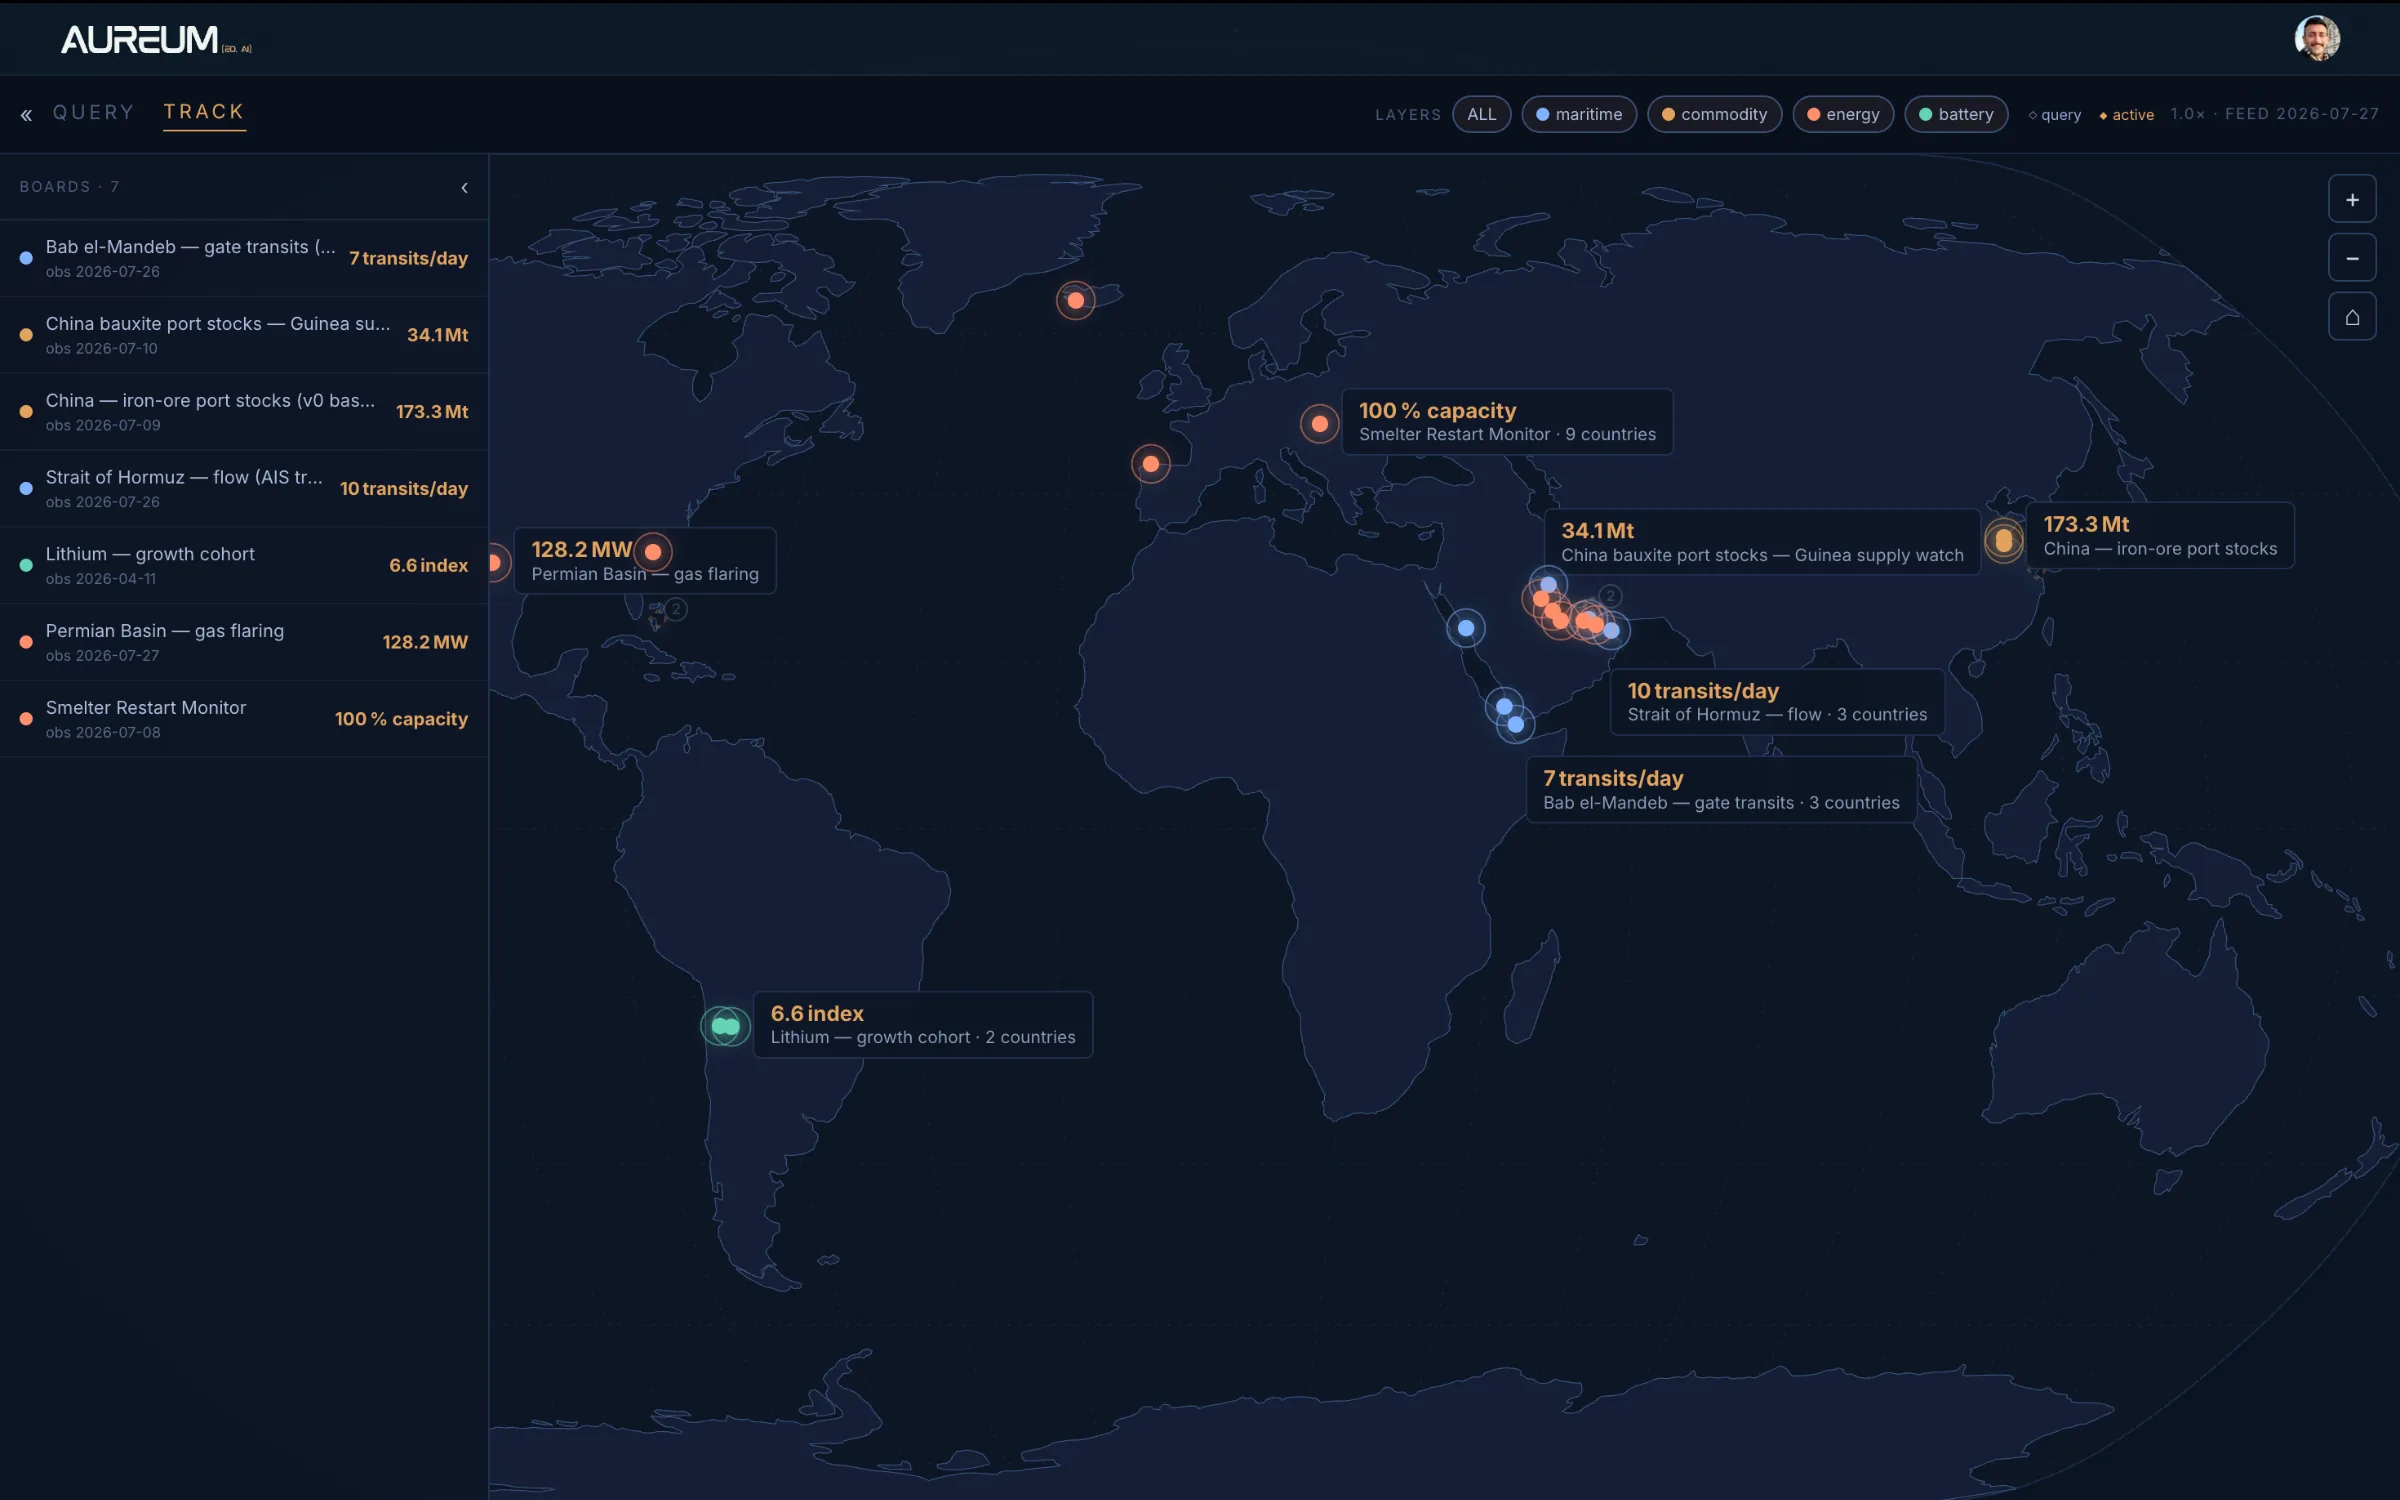
Track.
Hand-built KPI boards on the physical assets that move battery theses.
Use the arrows or the rail below to move through the tour.
Questions DIY lithium investors ask
Follow lithium ponds on Track
Beta access to Track KPIs and Query.