Red Sea corridor
See choke point activity before the headlines settle.
For DIY energy and macro investors. Track Bab el-Mandeb tanker density and rerouting patterns directly from space.
Watchlist
1 signal
The problem
Why macro shipping theses lag during crisis.
AIS transponders go dark.
Vessels turn off transponders when entering high-threat zones, leaving public tracking maps blind.
Social rumours create noise.
Unverified social media claims trigger market volatility hours before official maritime statements land.
Institutional tools stay locked away.
Specialised satellite radar and maritime risk feeds are packaged for institutional desks, not DIY investors.
Aureum's solution
Collapse the choke-point stack into one Track board.
Choke-point KPIs that refresh.
Monitor real vessel movement and transit volume around Bab el-Mandeb directly on the Track board.
Clear evidence when transponders dark.
Satellite imaging captures physical hulls on the water regardless of AIS radio status.
Verify claims with Query.
When headlines claim a full corridor closure, use Query to verify current congestion and vessel density in minutes.
How it works
Track the corridor. React on concrete facts.
Follow Bab el-Mandeb on Track.
The Red Sea corridor board sits alongside other physical-economy Track boards.
Follow daily transit trends on Track.
Observe aggregate vessel flows and diversion markers updated as new satellite passes complete.
Query headline breaks.
When news of disruption breaks, ask Query for recent physical evidence at specific choke points.
Follow Red Sea corridor on Track.
A short walkthrough of Track for this job.
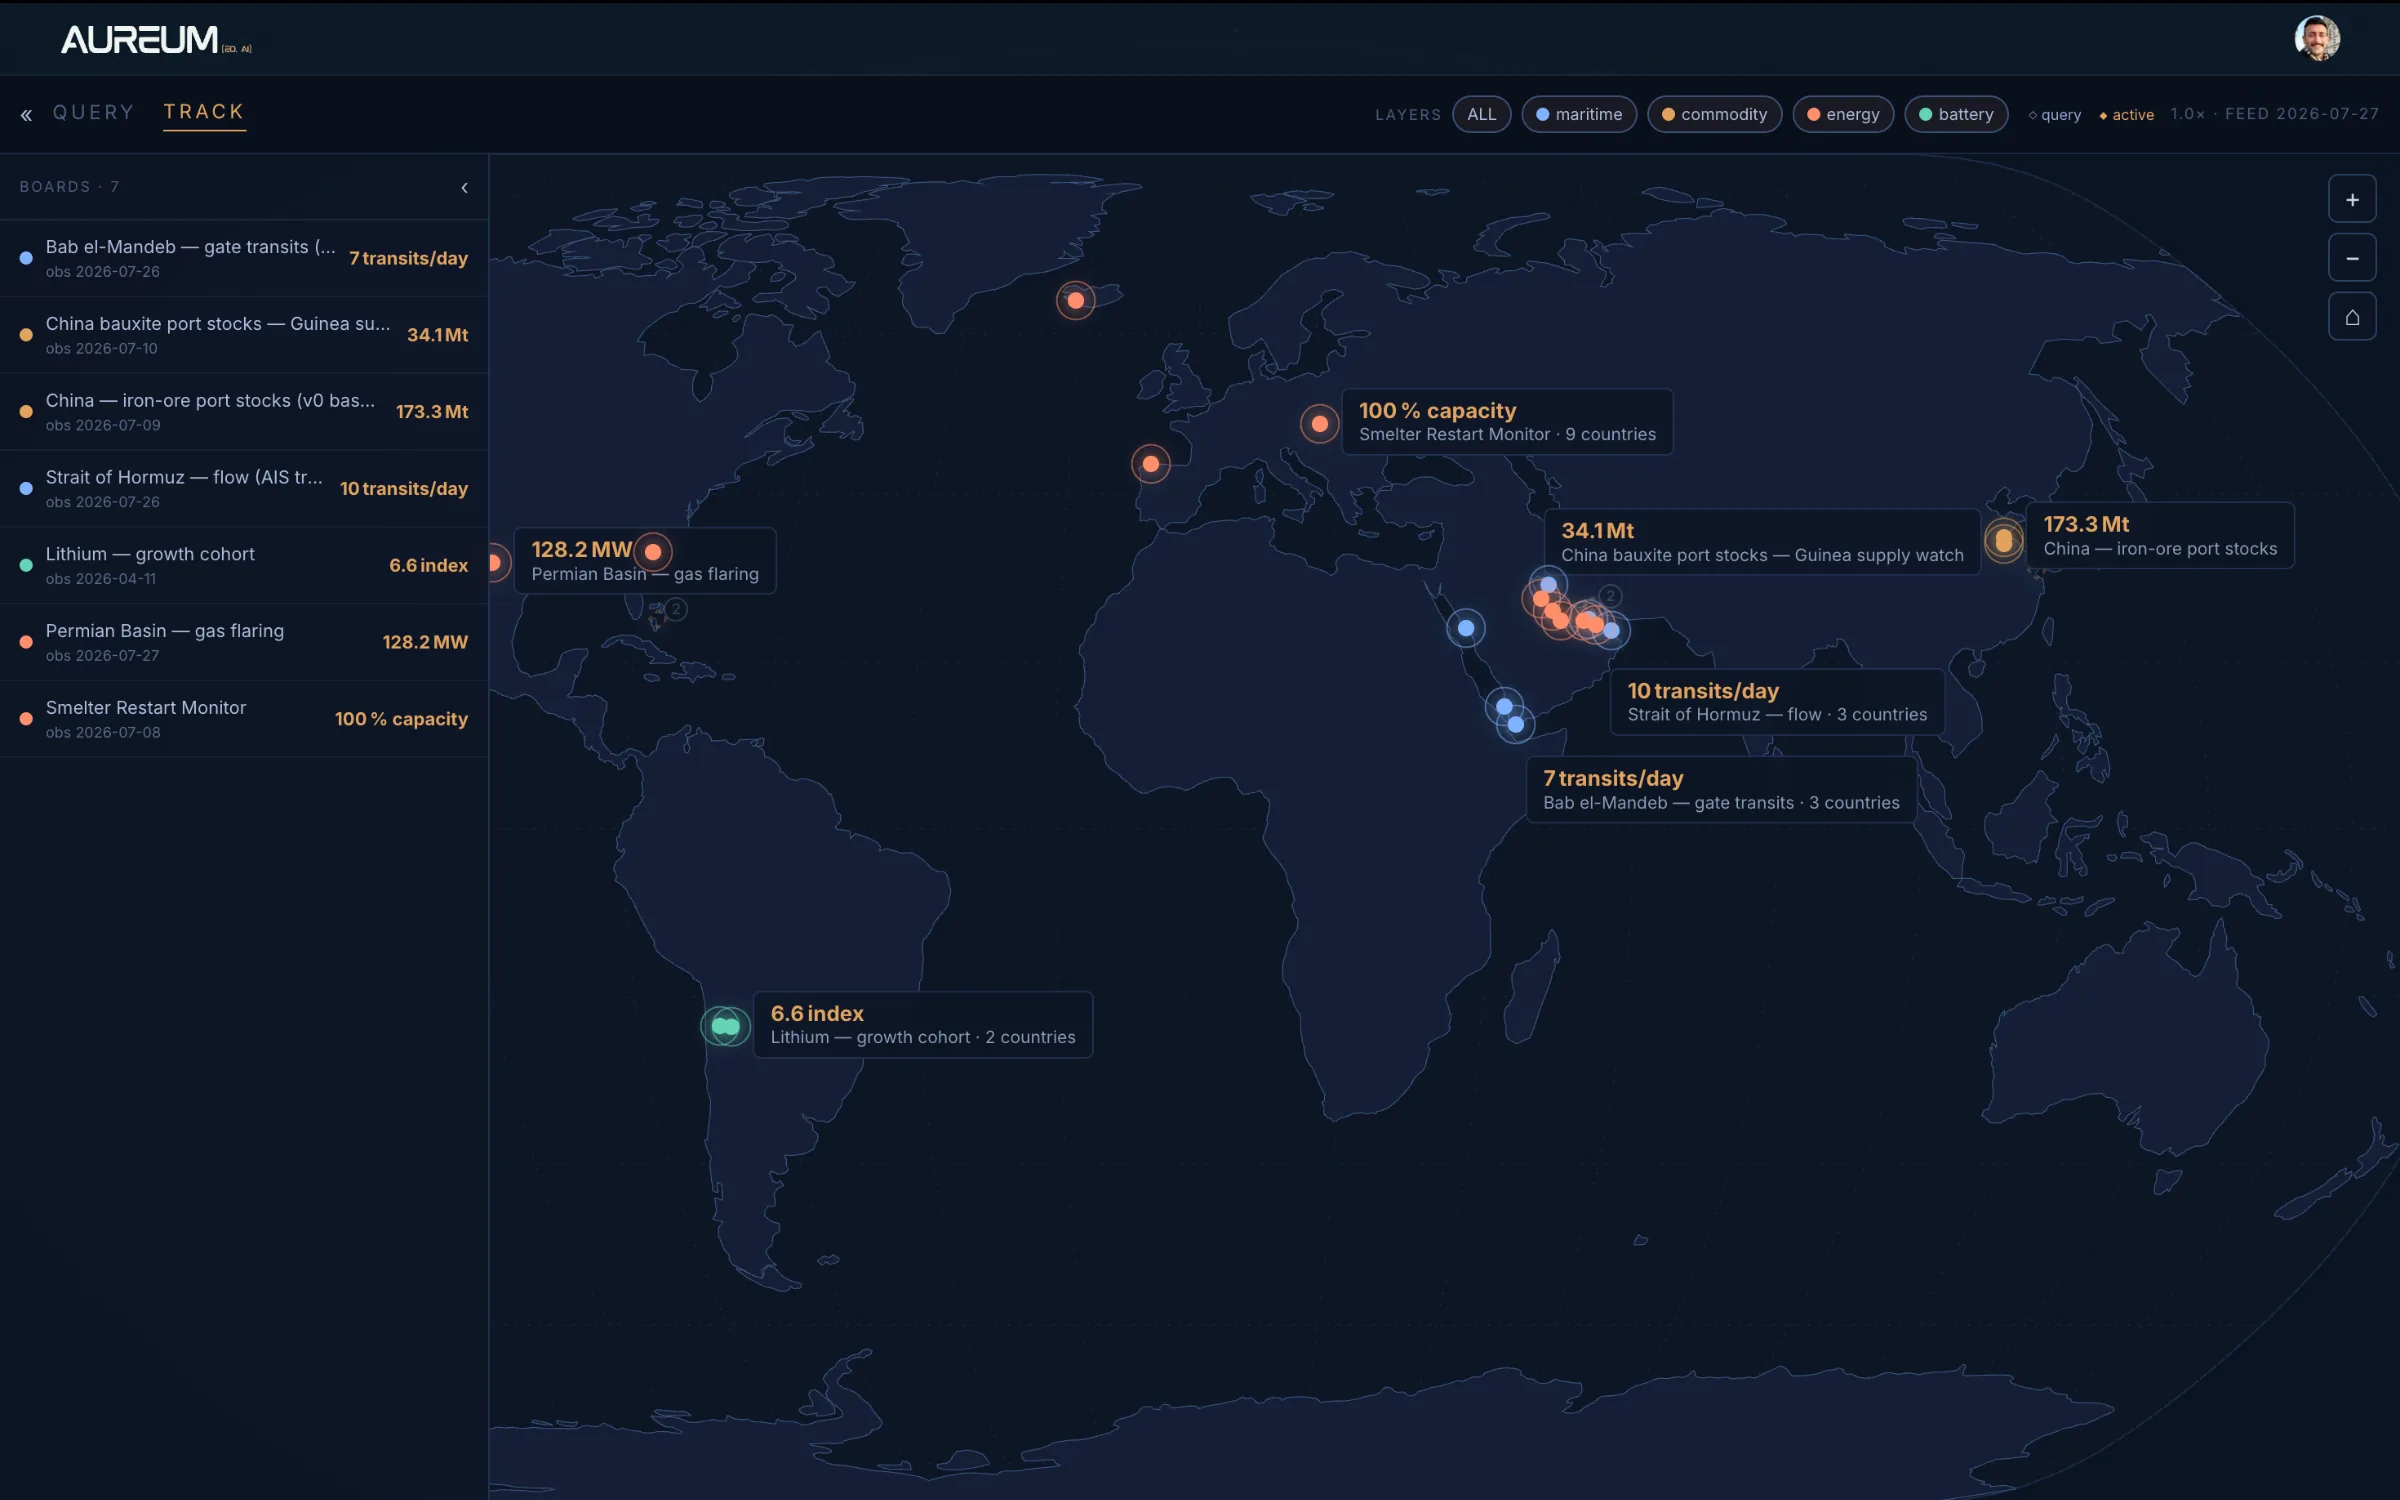
Track.
Hand-built KPI boards on the physical assets that move your thesis.
Use the arrows or the rail below to move through the tour.
Questions DIY investors ask about Red Sea shipping risk
Follow the Red Sea corridor on Track
Beta access to Bab el-Mandeb tracking KPIs and site-level Query.